On 4th January 1902, Charles Dow revealed two founding principles of technical analysis in his editorial of the Wall Street Journal:
“It is bull period as long as the average of one high point exceeds that of previous high points. It is a bear period when the low point becomes lower than the previous low points.”
“Nothing is more certain than that the market has three well defined movements which fit into each other.”
Advocated by Dr. Pravin Mokashi in 2008, to reveal his discovered methodology of integrating three market trends in the following words:
“Intrinsically concealed trends, targets & momentum are evidently revealed by the sequential charts of traded financial markets & securities. Identifying & connecting the prominent supports & resistances of sequential charts is the essence of triple trend integration.”
Sigma-Line System is the practical expression of Charles Dow’s two principles & Dr. Pravin Mokashi’s Theory of Triple Trend Integration.
Sigma (Σ), the Greek alphabet, is used in mathematics as a symbol of sum of elements. In this trading system, one line, whether tide, wave or ripple, is a sum of five elements of trading & investing viz. price trends, supports, resistances, targets & momentum, therefore, its Sigma-Line System.
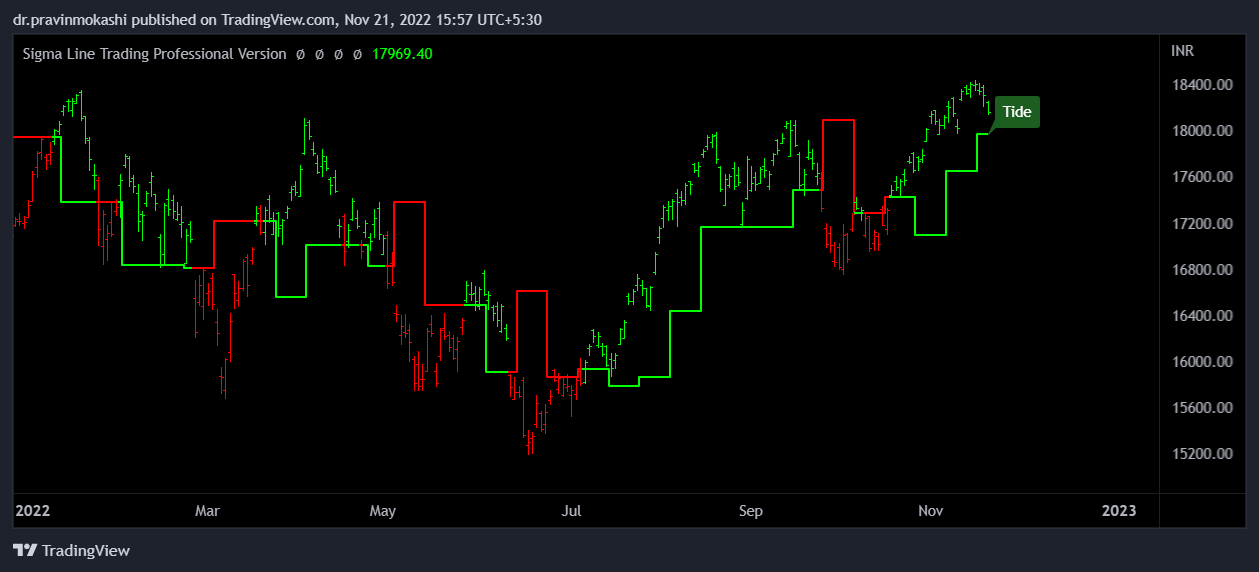
Ripple, Wave & Tide are the lines drawn by connecting the specific supports & resistances of sequential charts.
Sigma-line indicates major or long term trends, supports, resistances & thereby the targets.
Sigma-line indicates intermediate or medium term trends, supports, resistances & thereby the targets.

Sigma-line indicates minor or short term trends, supports, resistances & thereby the targets.

Bull Line is the average of the bullish tide, wave & ripple sigma lines confirming bullish trend. Price bars above the green bull line are in strong bullish trend.

Bear Line is the average of the bearish tide, wave & ripple sigma lines confirming bearish trend. Price bars below the red bear line are in strong bearish trend.

Trend is the direction of price movement. In sigma-line system, trend can be either bullish or bearish. Green & red colours are used to indicate bullish & bearish trend respectively.
Trend is bullish when green price bars are above the green Bull Line.

Trend is bullish when green price bars are above the green sigma-line.

Bullish trend is strong when green price bars are above the green tide, wave & ripple.

Trend is bearish when red price bars are below the red Bear Line.

Trend is bearish when red price bars are below the red sigma-line.[10]

Bearish trend is strong when red price bars are below the red tide, wave & ripple.[11]

Sigma-lines below the current price bars are the supports.
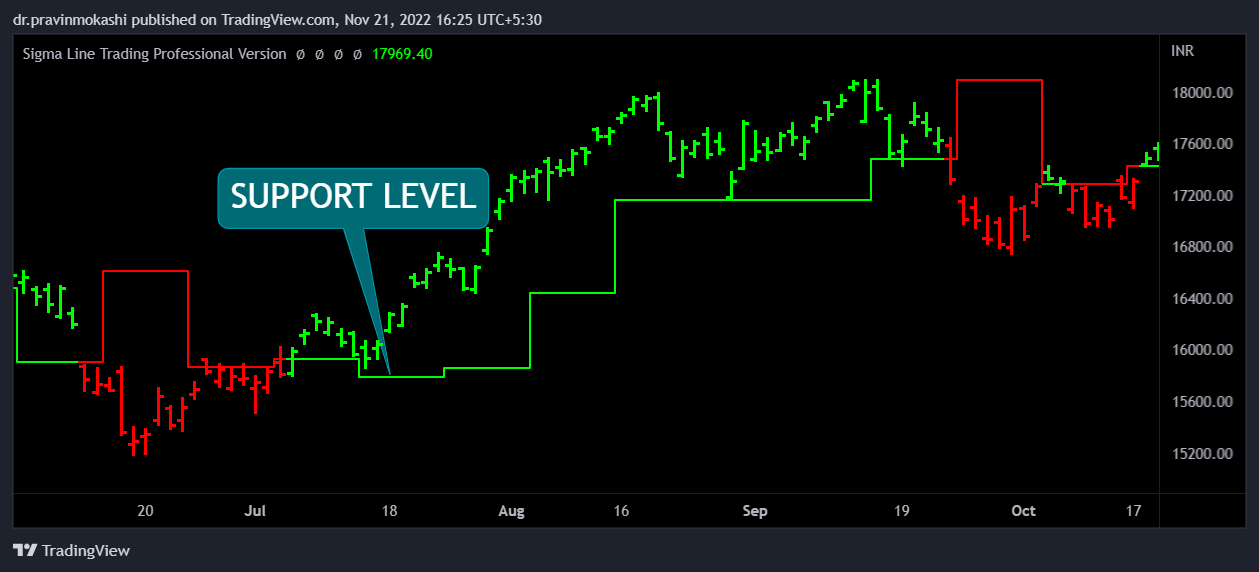
Earlier lows of price bars, below the current price bars are also the supports.

• Bull line is a support if it is between the price bars & sigma line.

Lower price targets are indicated by the supports.

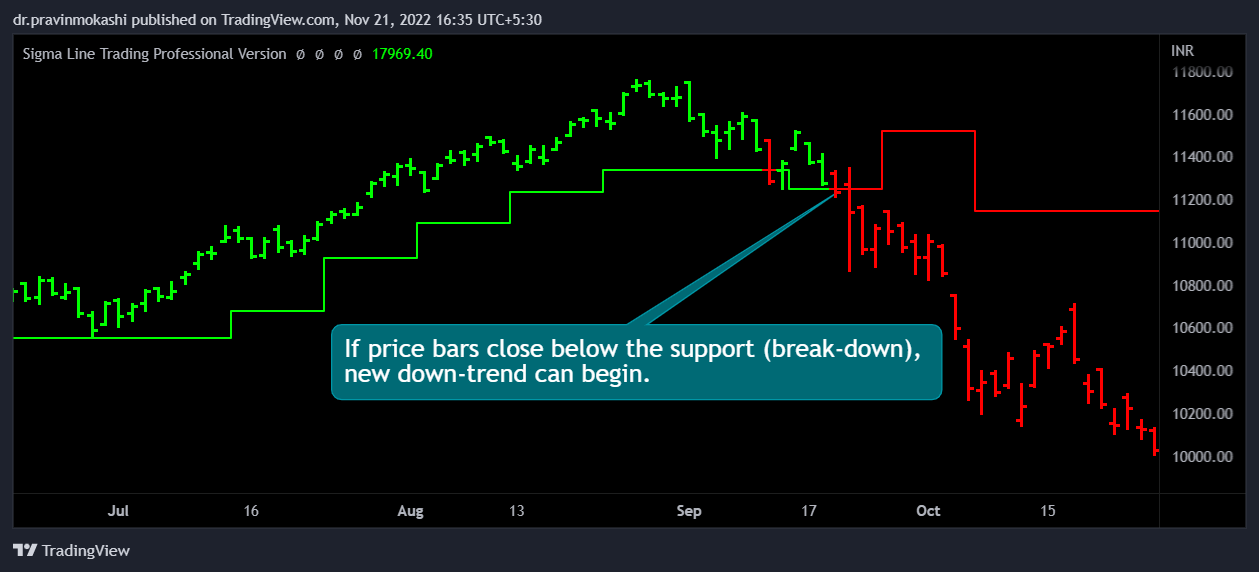
Bearish trend can halt at supports or even bounce-back to start a new up-trend.

If price bars close below the support (break-down), new down-trend can begin. [15]
Sigma-lines above the current price bars are the resistances.

Earlier highs of price bars, above the current price bars are also the resistances.

• Bear line is a resistance if it is between the price bars & sigma line.

Higher price targets are indicated by the resistances.

Bullish trend can halt at resistances or even rebound to start a new down trend.

If price bars close above the resistance (break-out), new up-trend can begin.

Momentum is the speed of price movement.
Up trending (higher highs & higher lows) & shorter sigma-line segments indicate strong bullish momentum.
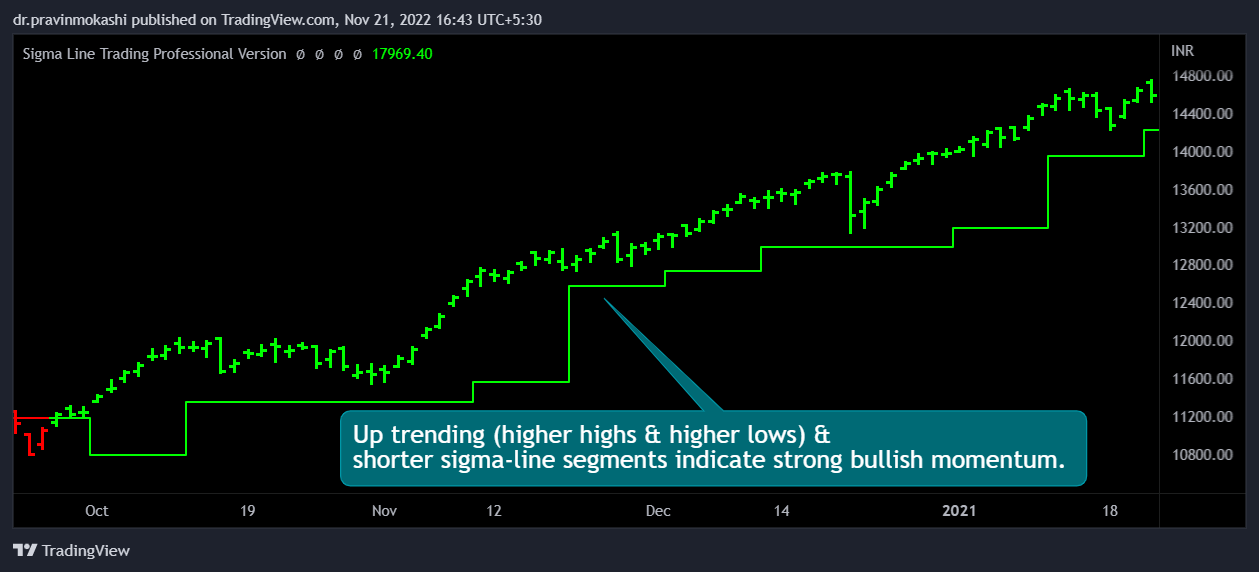
Flat & longer sigma line segments indicate weaker bullish momentum.

Length of sigma line segment is judged by comparing it with its adjacent segment.

Down trending (lower highs & lower lows) & shorter sigma-line segments indicate strong bearish momentum

Flat & longer sigma line segments indicate weaker momentum.

Length of sigma line segment is judged by comparing it with its adjacent segment.

Normally, sigma line segments flip in the direction of price trends. Higher highs & higher lows in uptrend and lower highs & lower lows in down trend.
Most of the times, sigma line segments flip in the opposite direction after the breakouts & break downs. Therefore, it is advisable to wait for the flip, before placing stoploss after the breakout & break down.[26][27]

