One Best Method

Sigma-line system is the simplest & the most effective method of trading & investing. Anyone & everyone can learn it easily within no time. It is effective in cash & derivative segments of all the markets of traded financial securities.

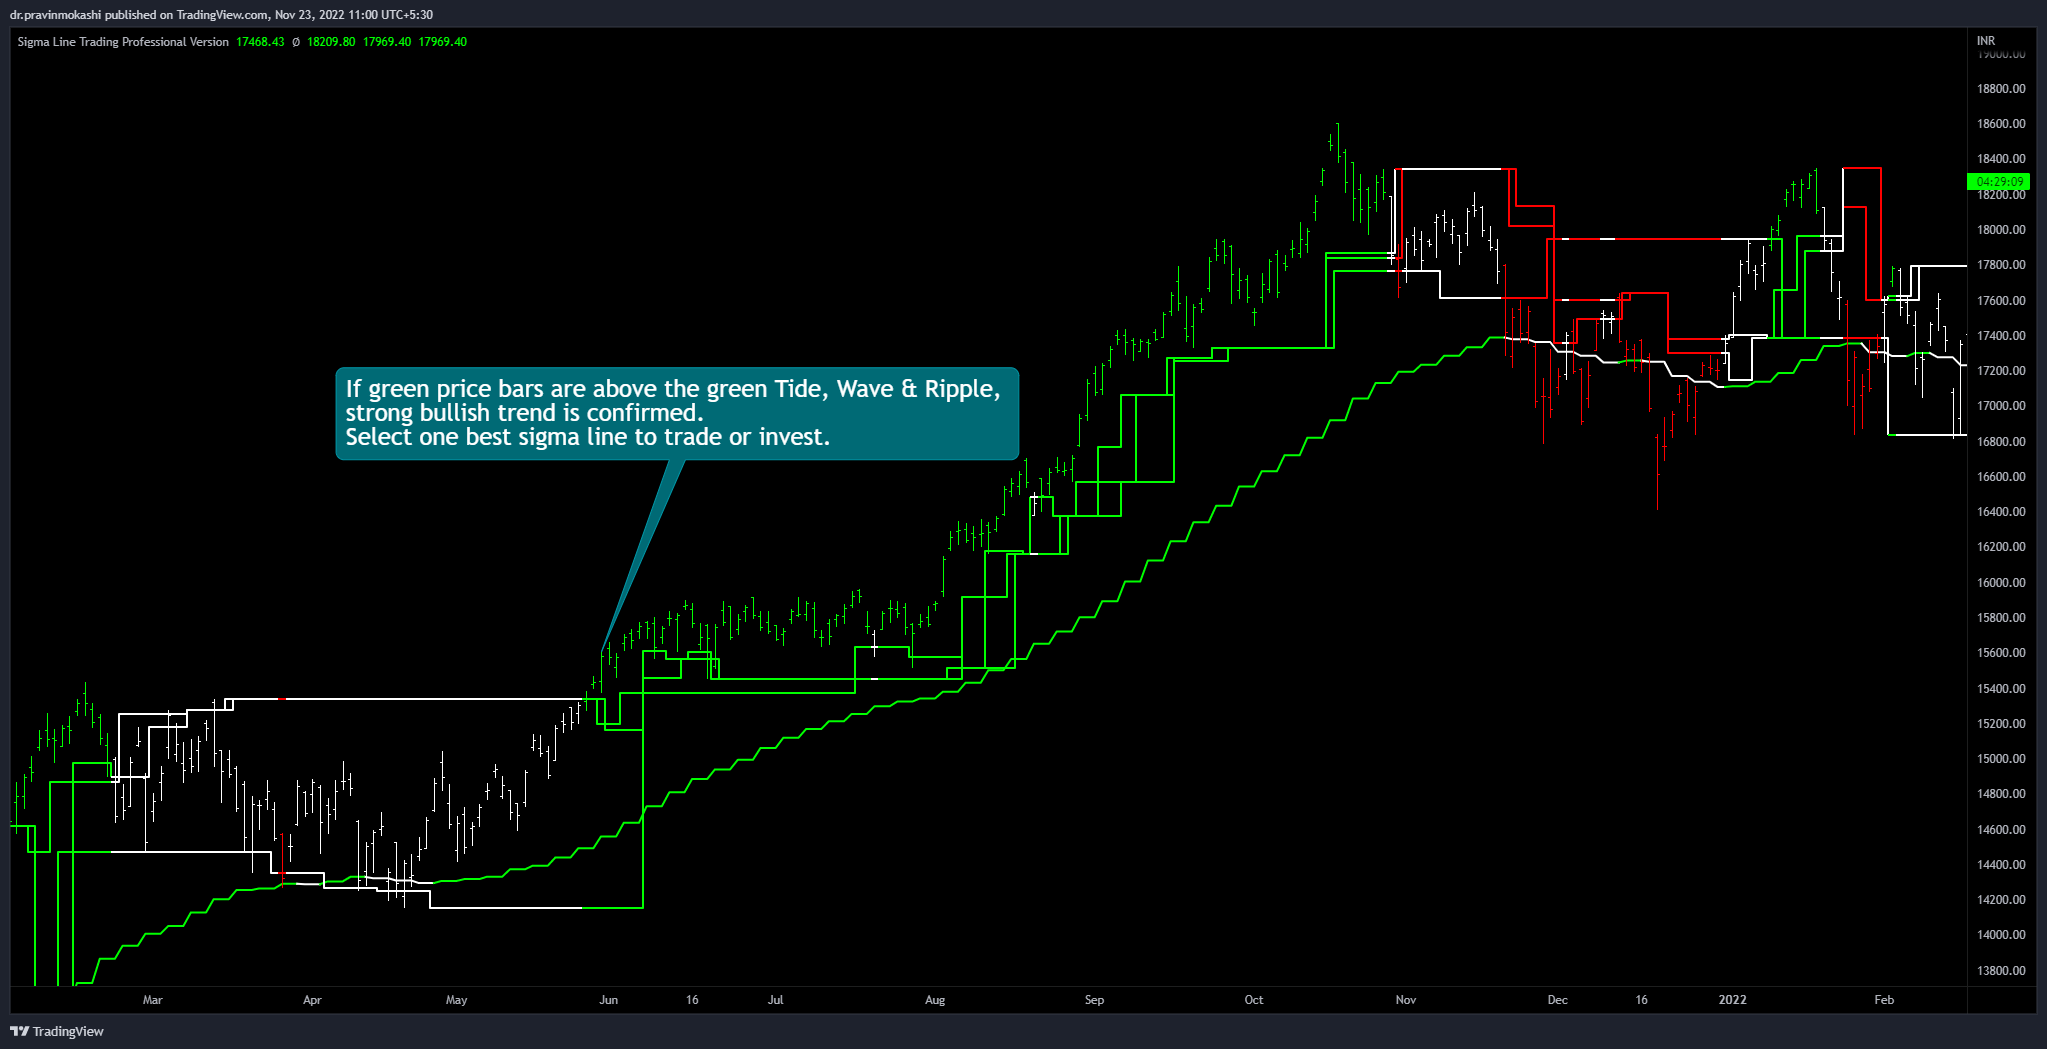
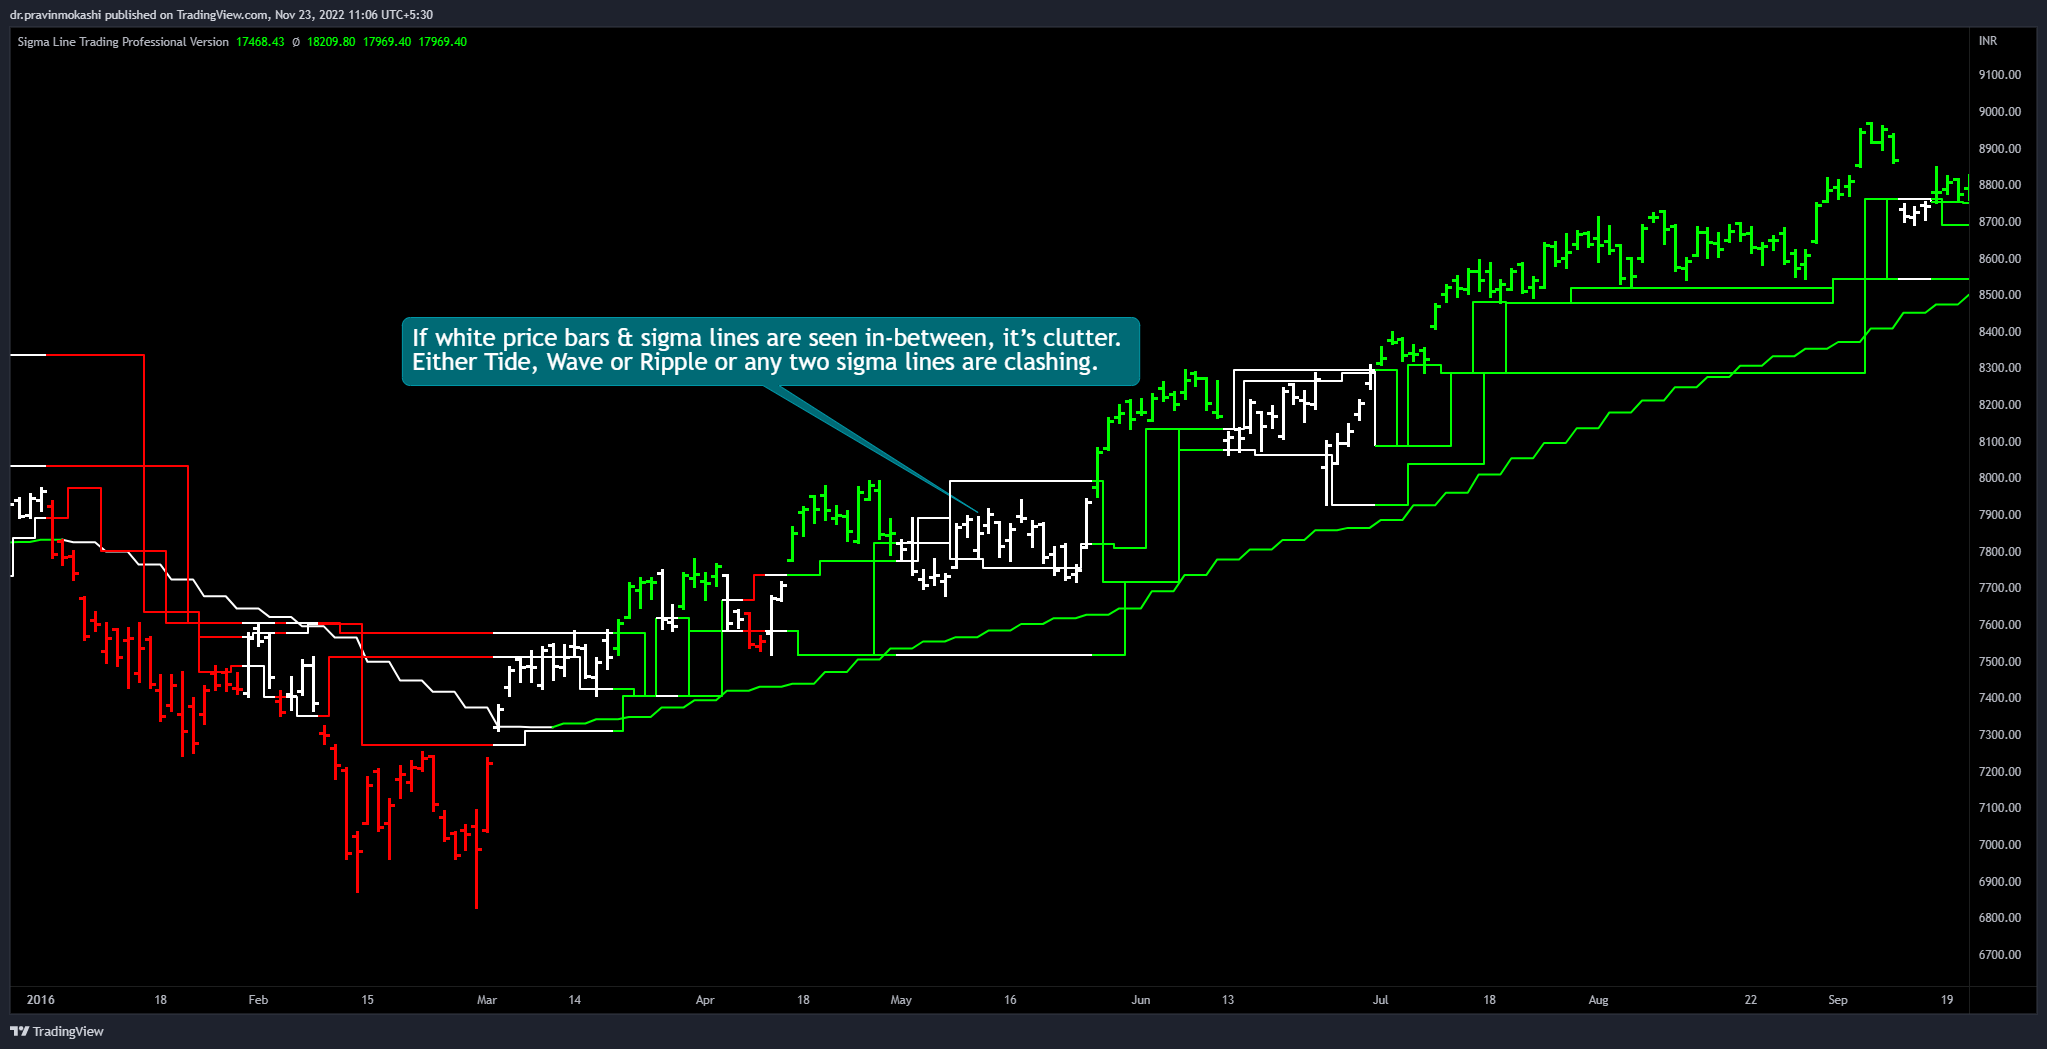
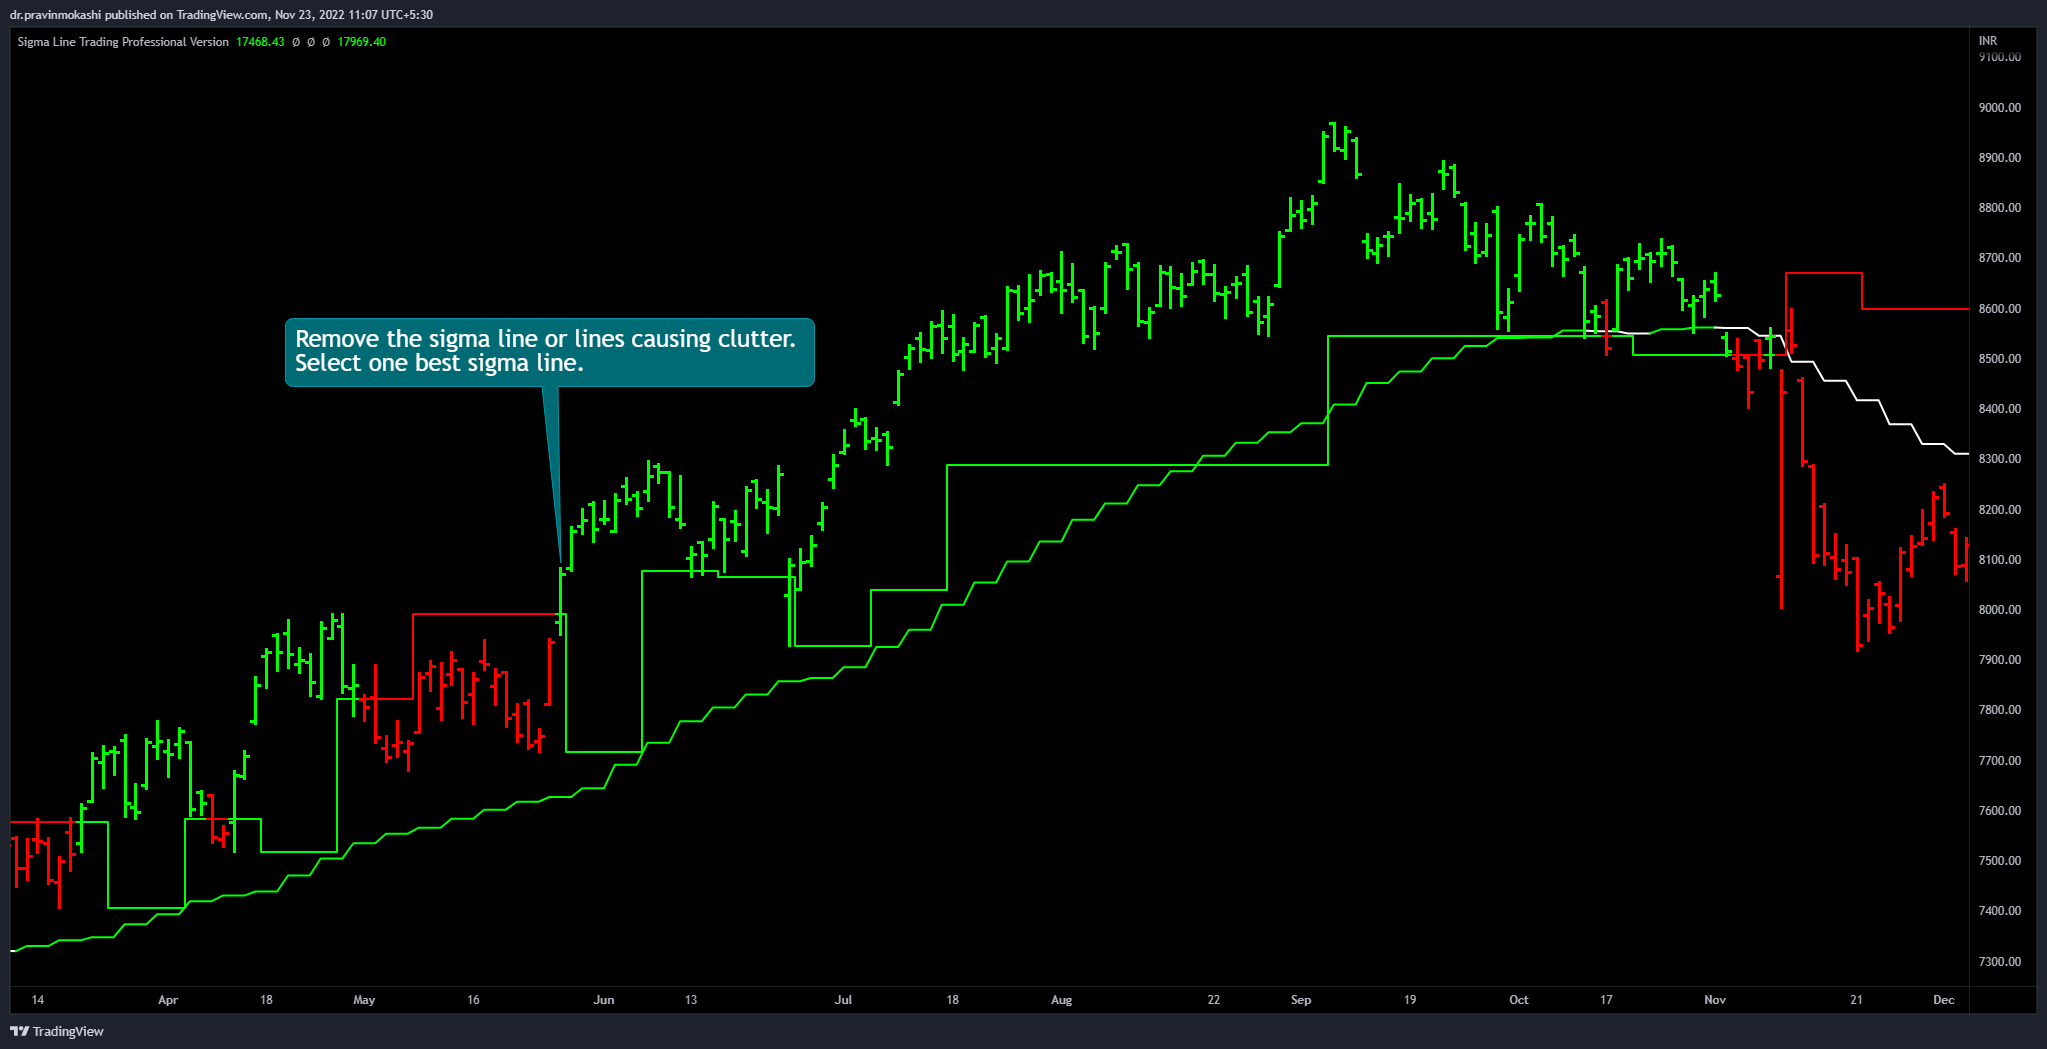
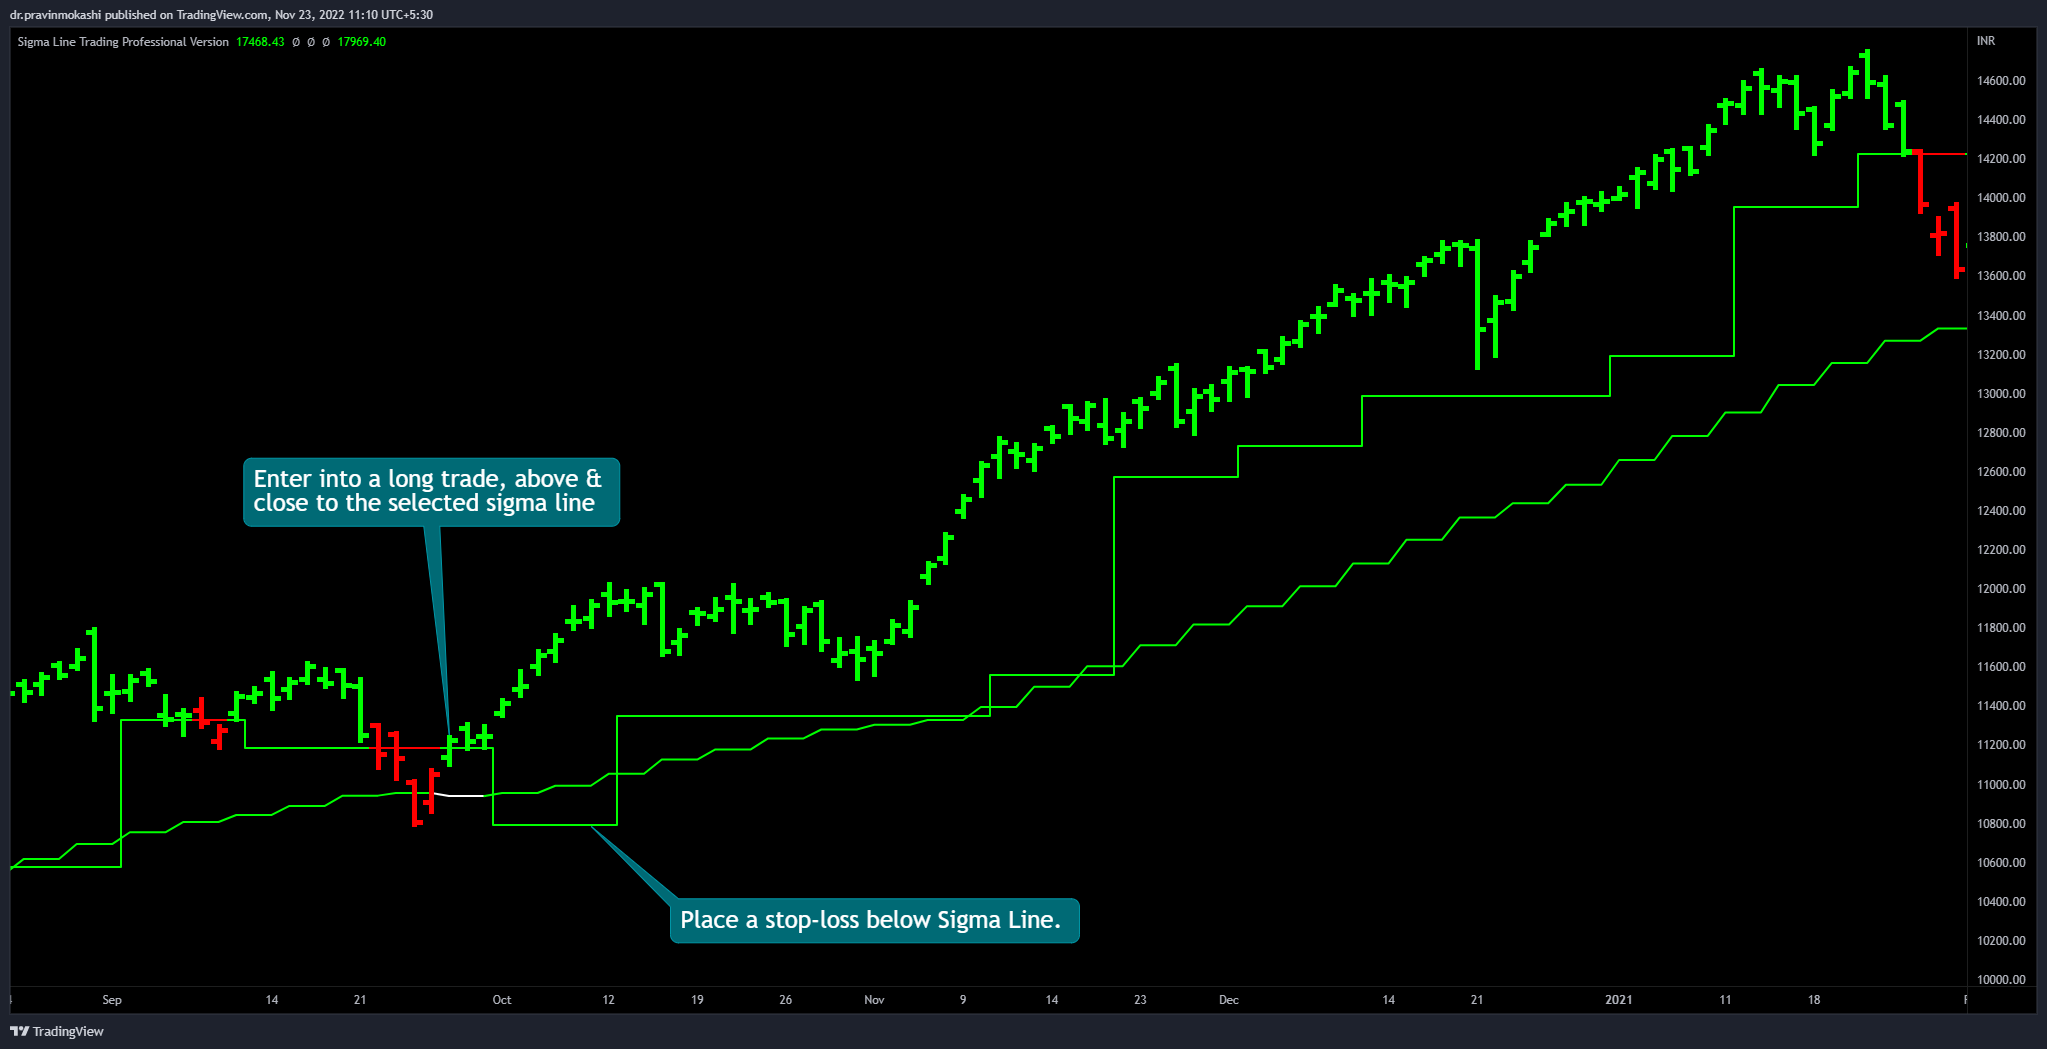
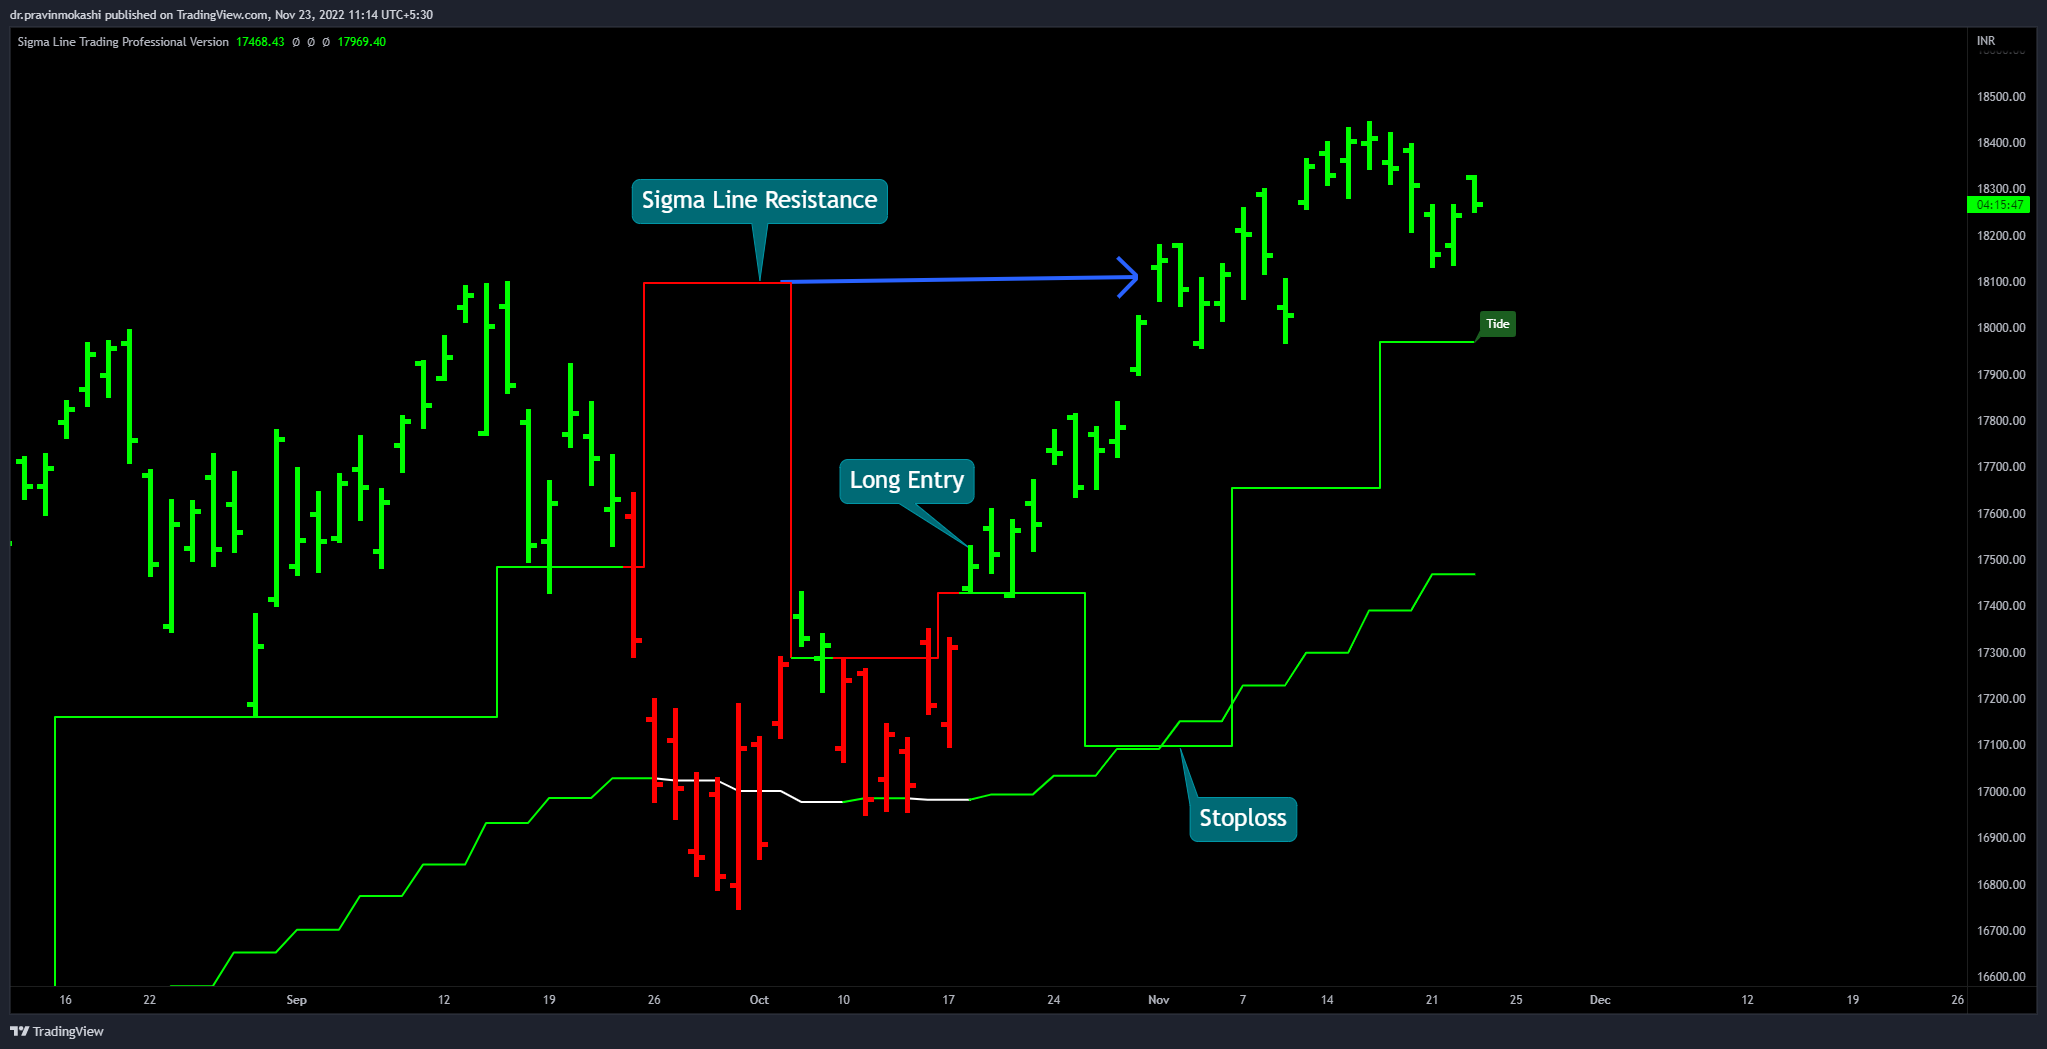
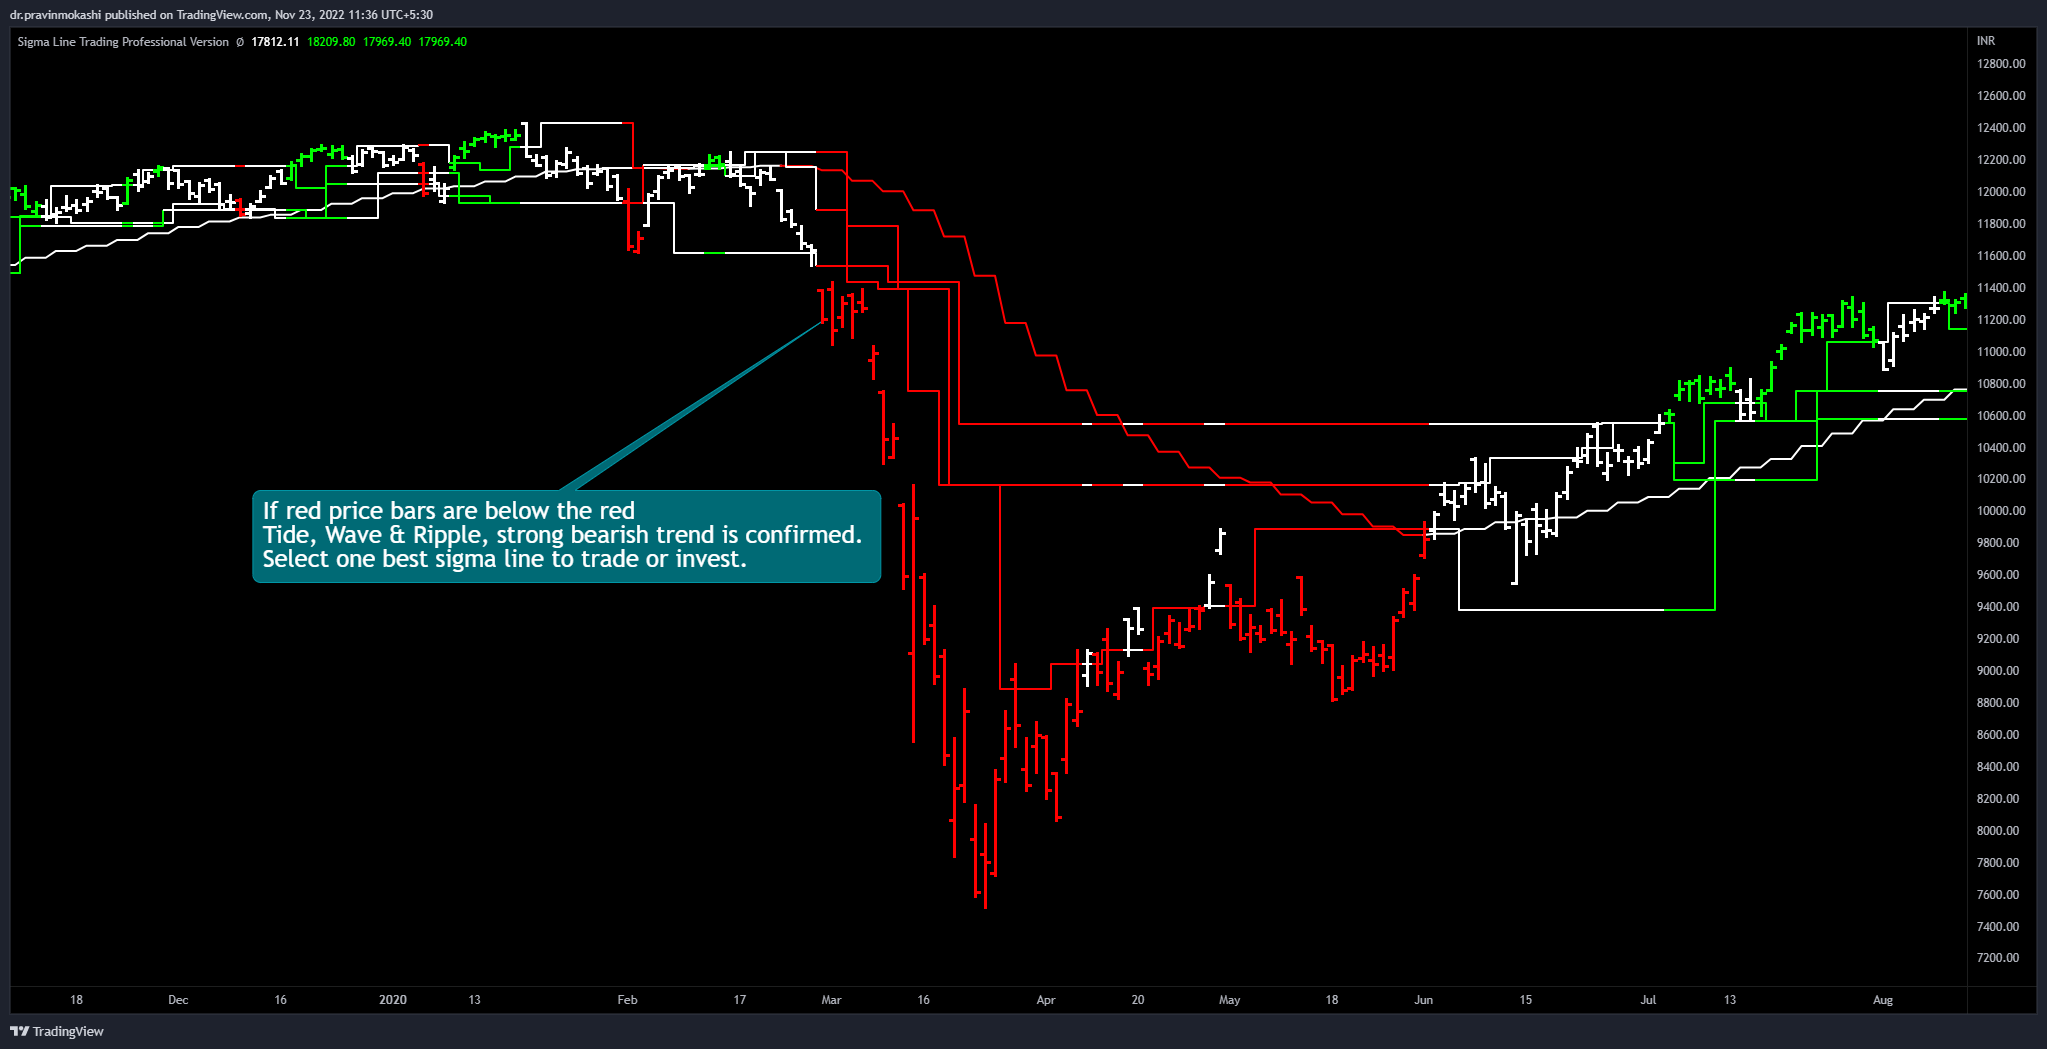
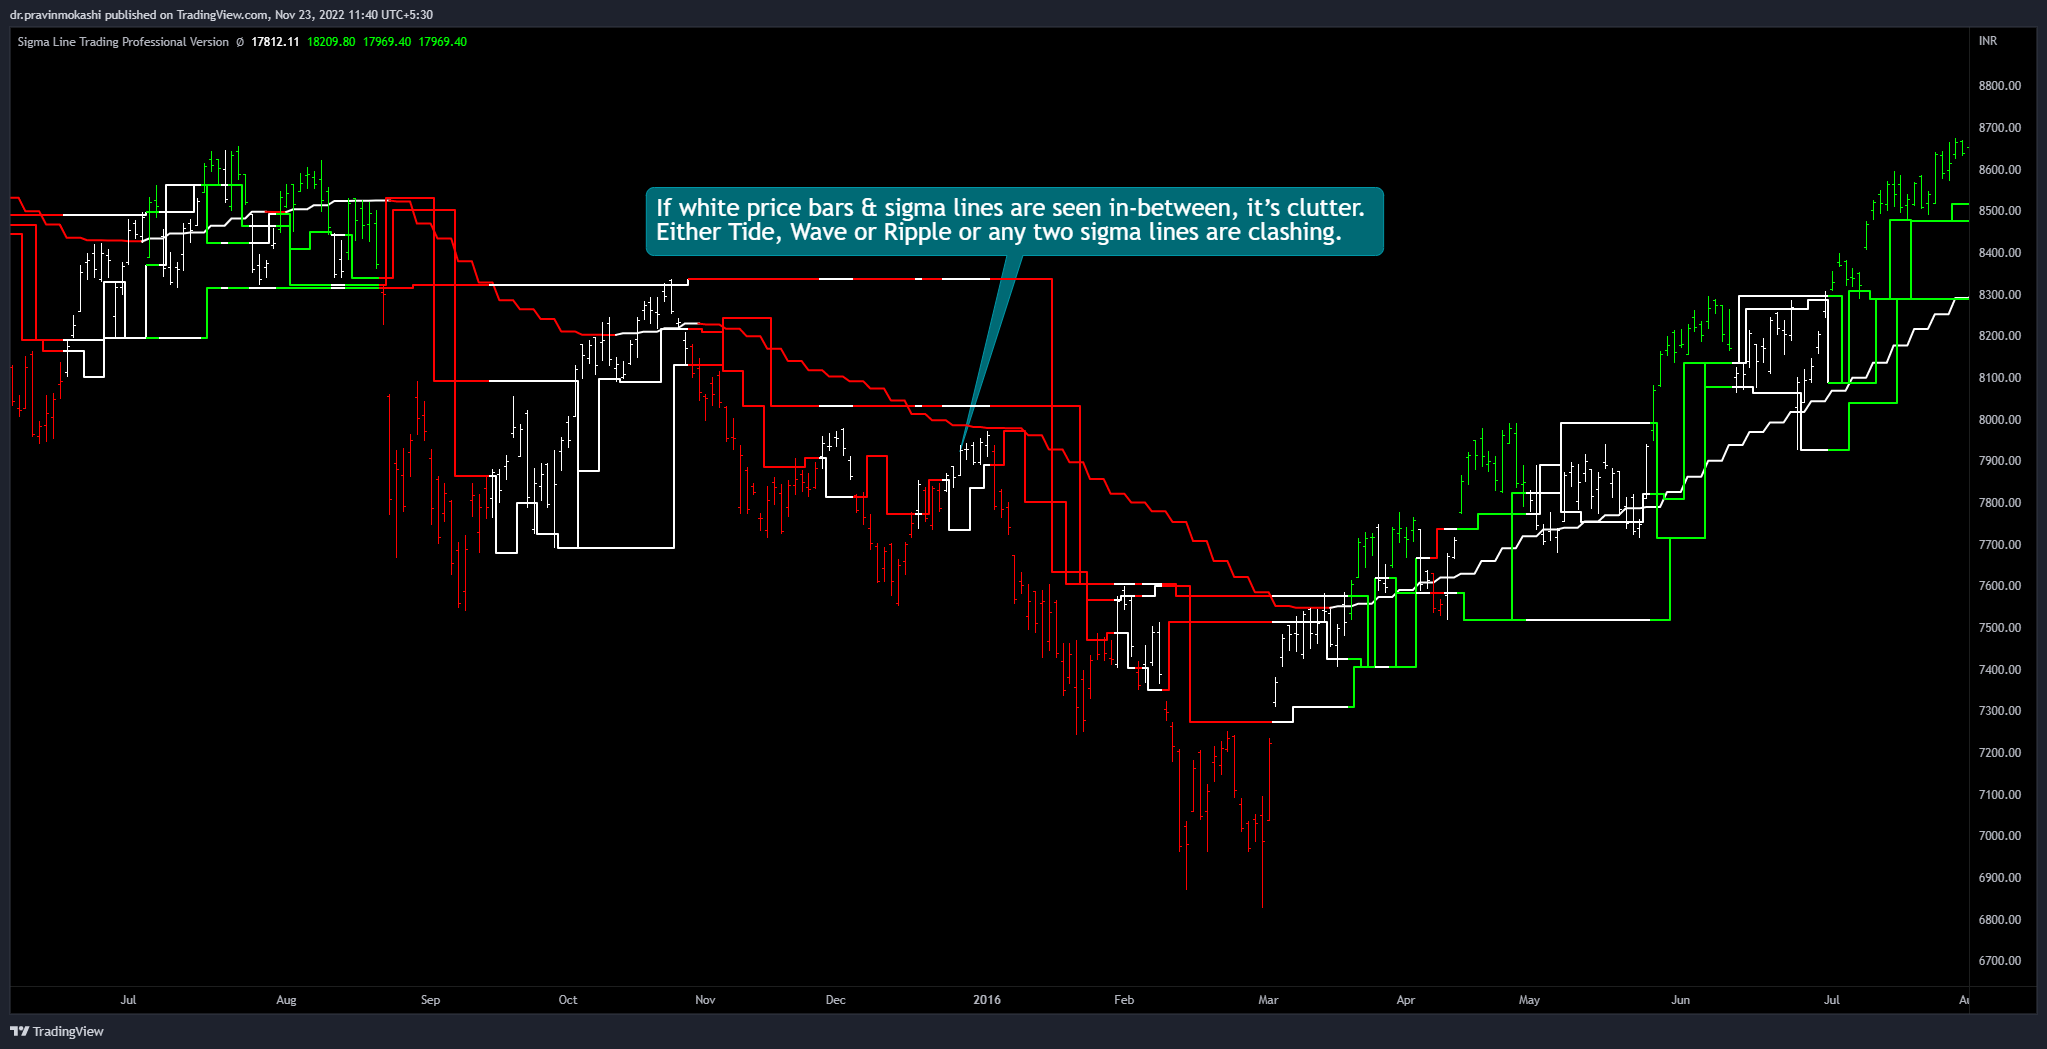
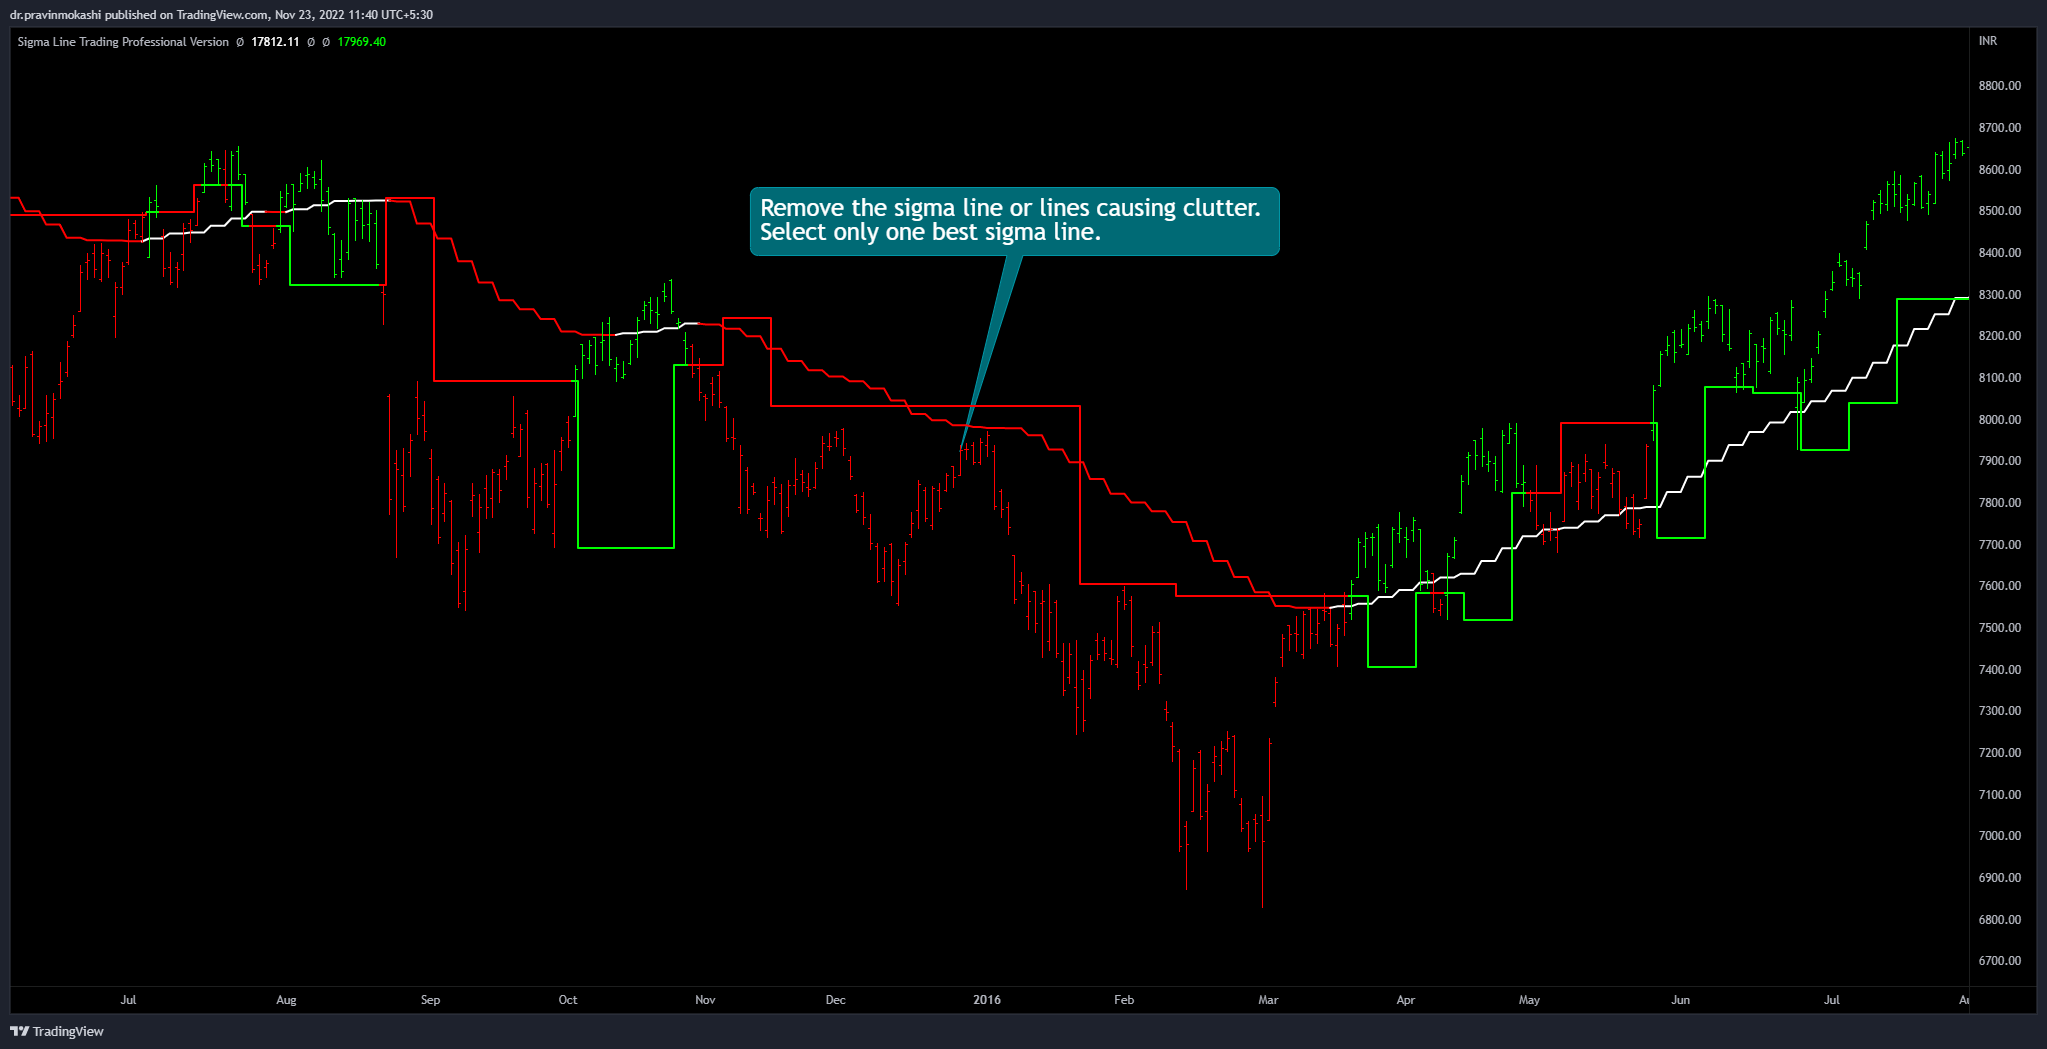
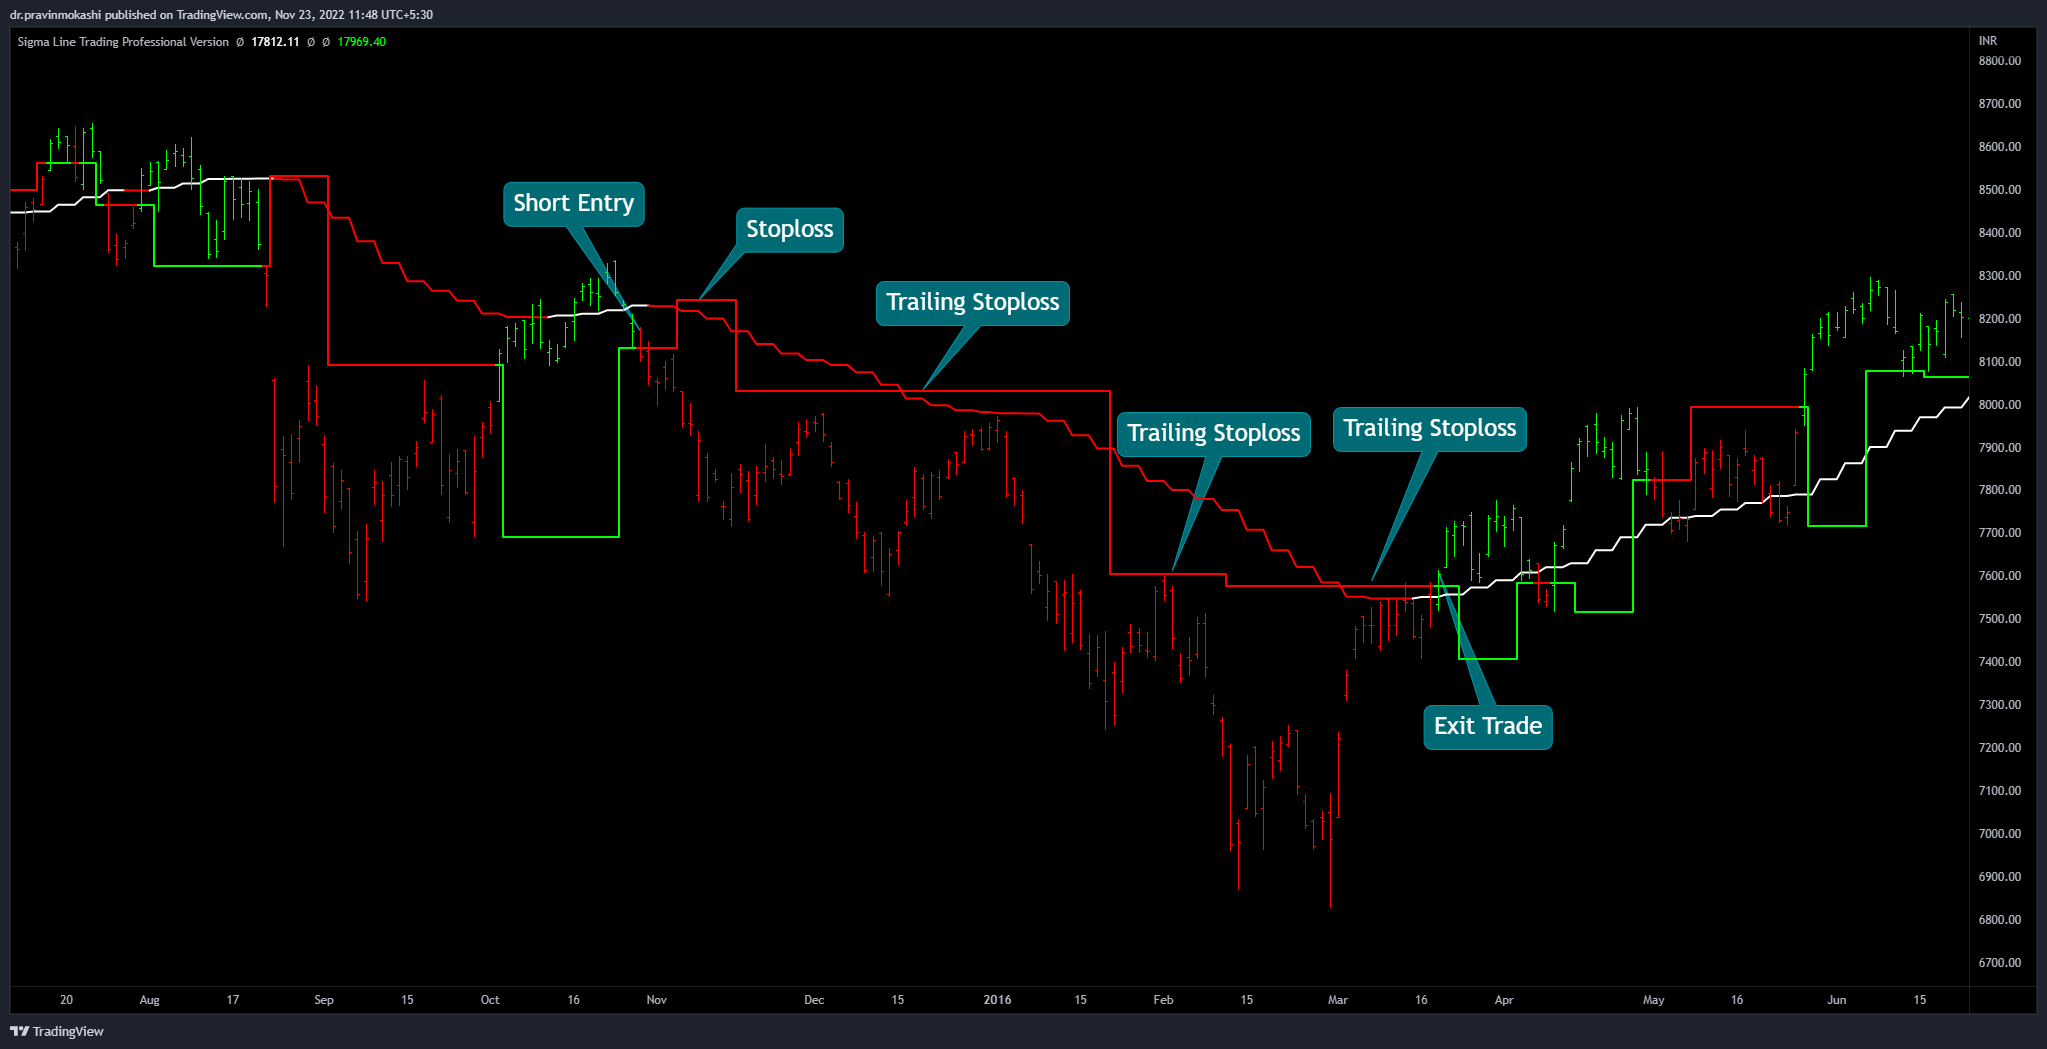
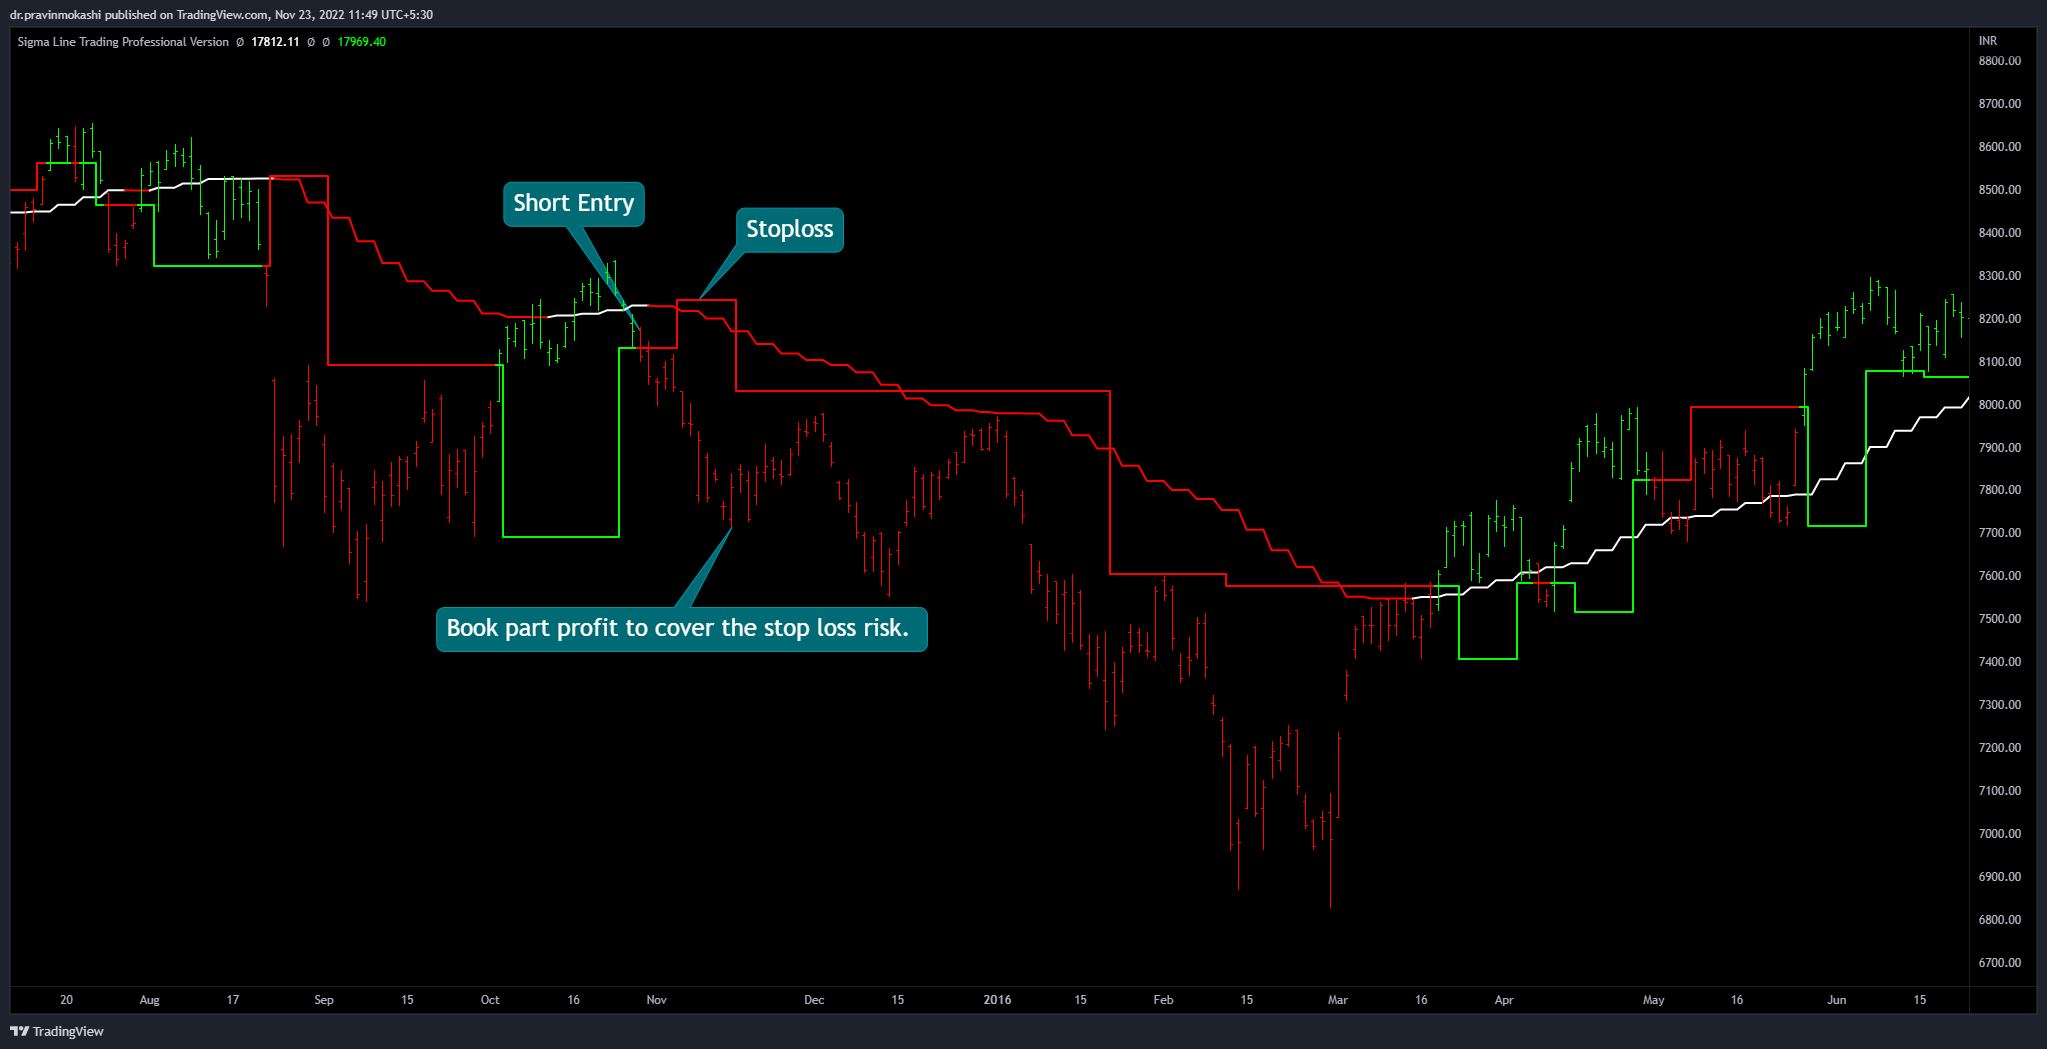
It’s a proven fact that markets have three trends viz. long term, medium term & short term. In sigma-line trading, Tide, Wave & Ripple lines reveal everything about the three trends, along with respective supports, resistances, targets & momentum.

Scalpers, intra-day, swing & positional traders as well as investors have been successfully using ‘One Best Method’ of in the markets of traded financial securities all over the world.

Let’s discuss the ‘One Best Method’ in just 3 steps.

1. Visit https://sigmalinetrading.com/faqs to watch video 1, 2 & 3 to understand how to login to Trading View software & get sigma line indicator. Also read the document Introduction to Sigma-Line Trading.

2. You will get a white price chart on the screen.

...

3. Select the stock, commodity, forex, etc. that you want to trade or invest.

4. Scalpers, intra-day, swing & positional traders as well as investors have been successfully using ‘One Best Method’ of using sigma lines in the markets of traded financial securities all over the world.
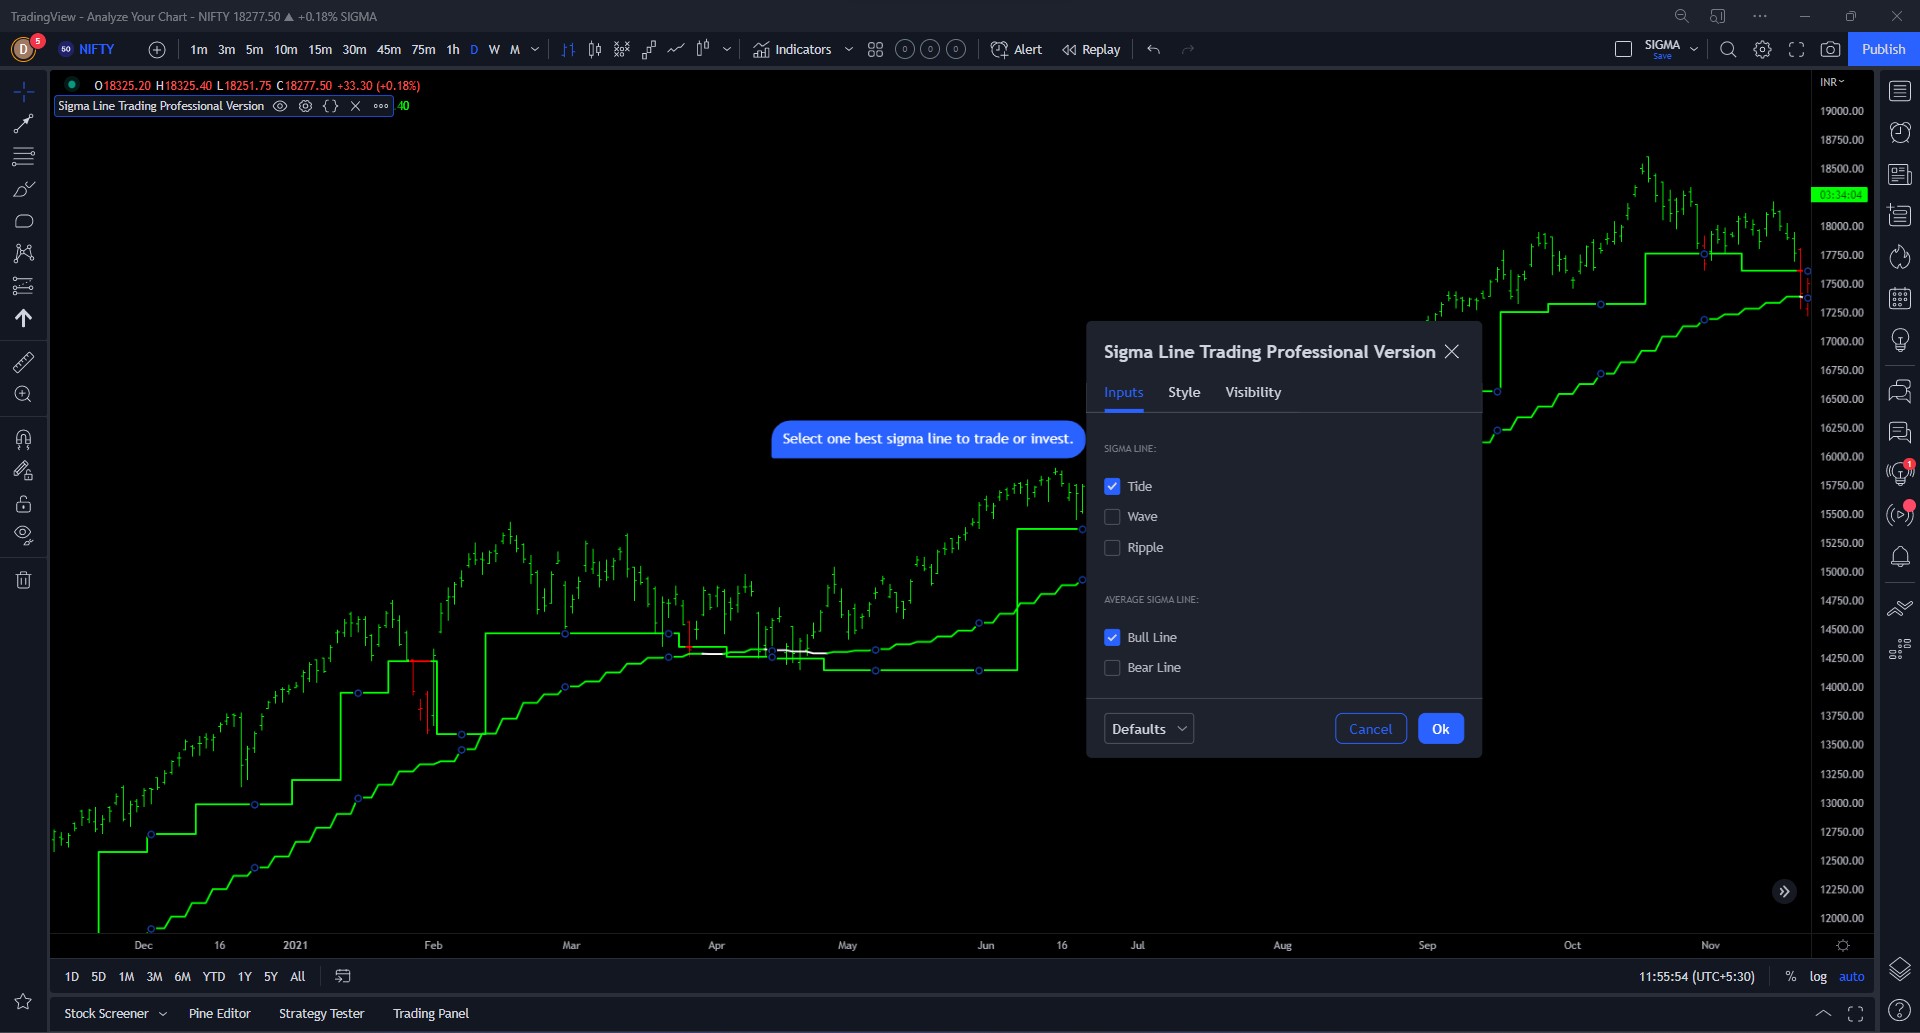
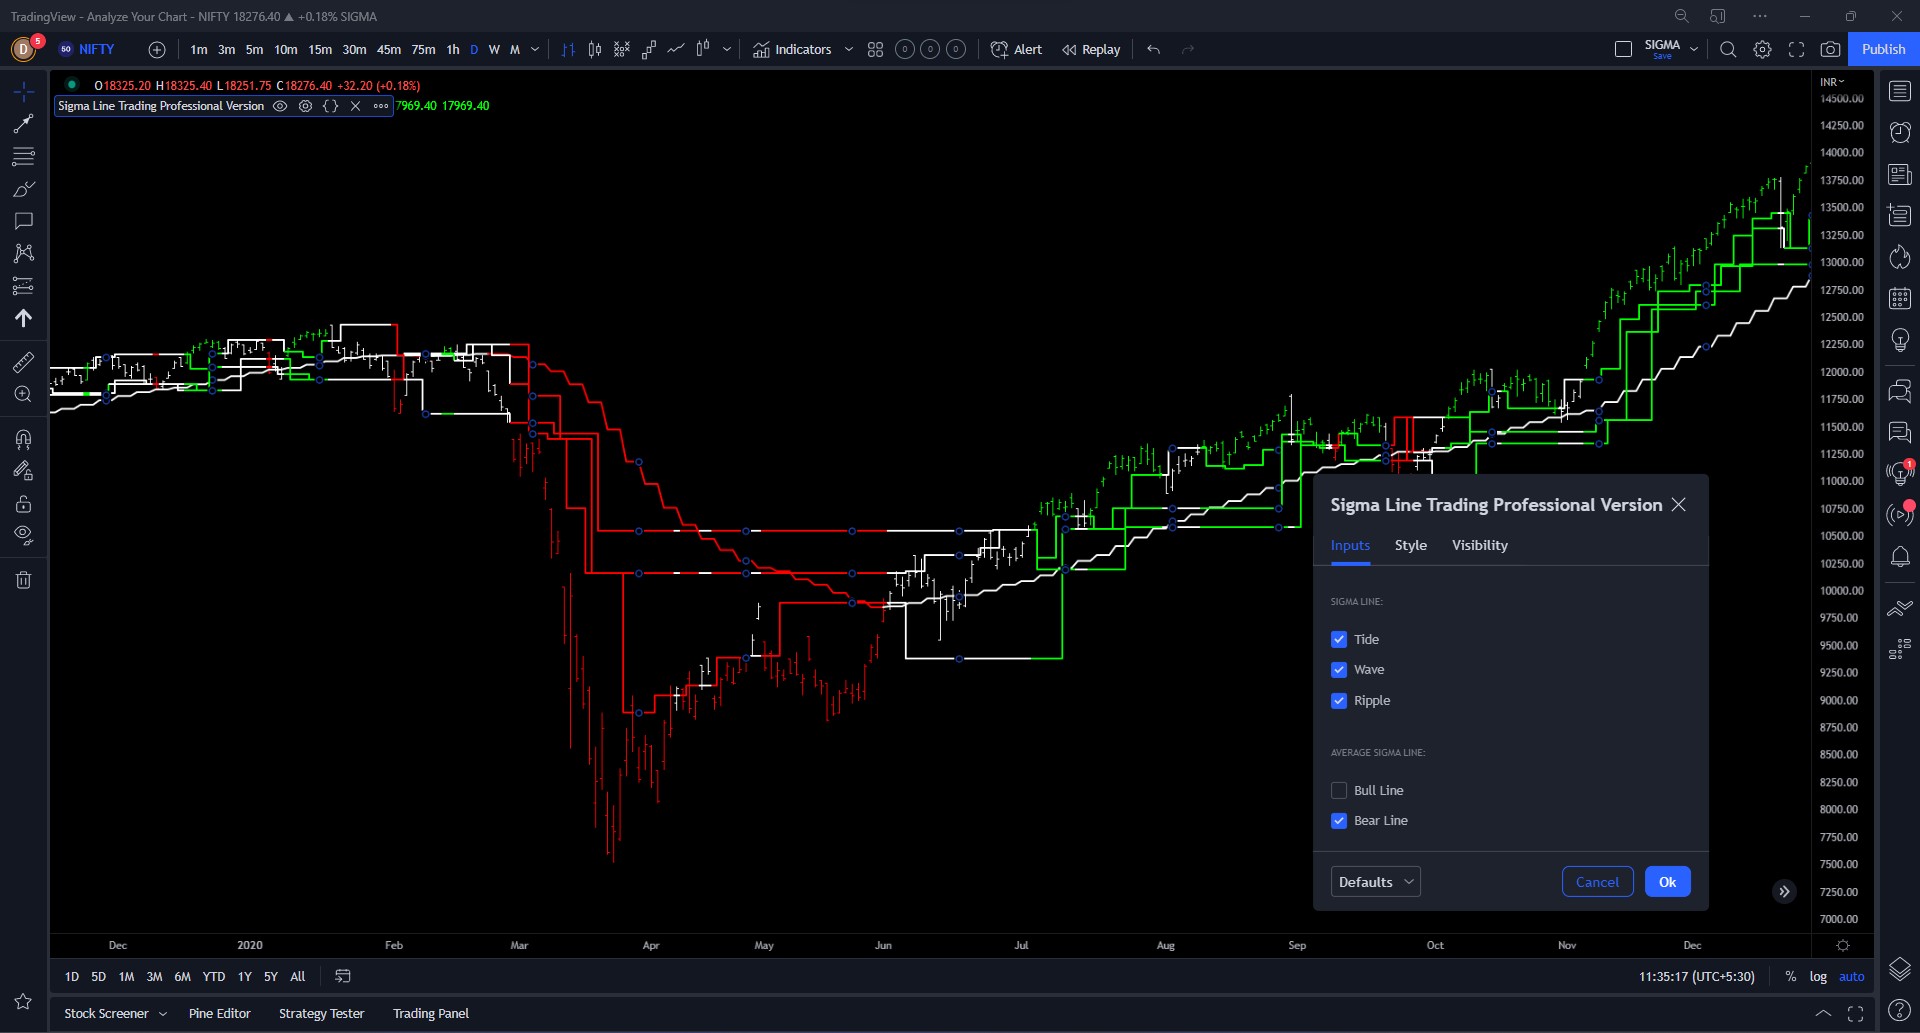
1. Click Settings

...

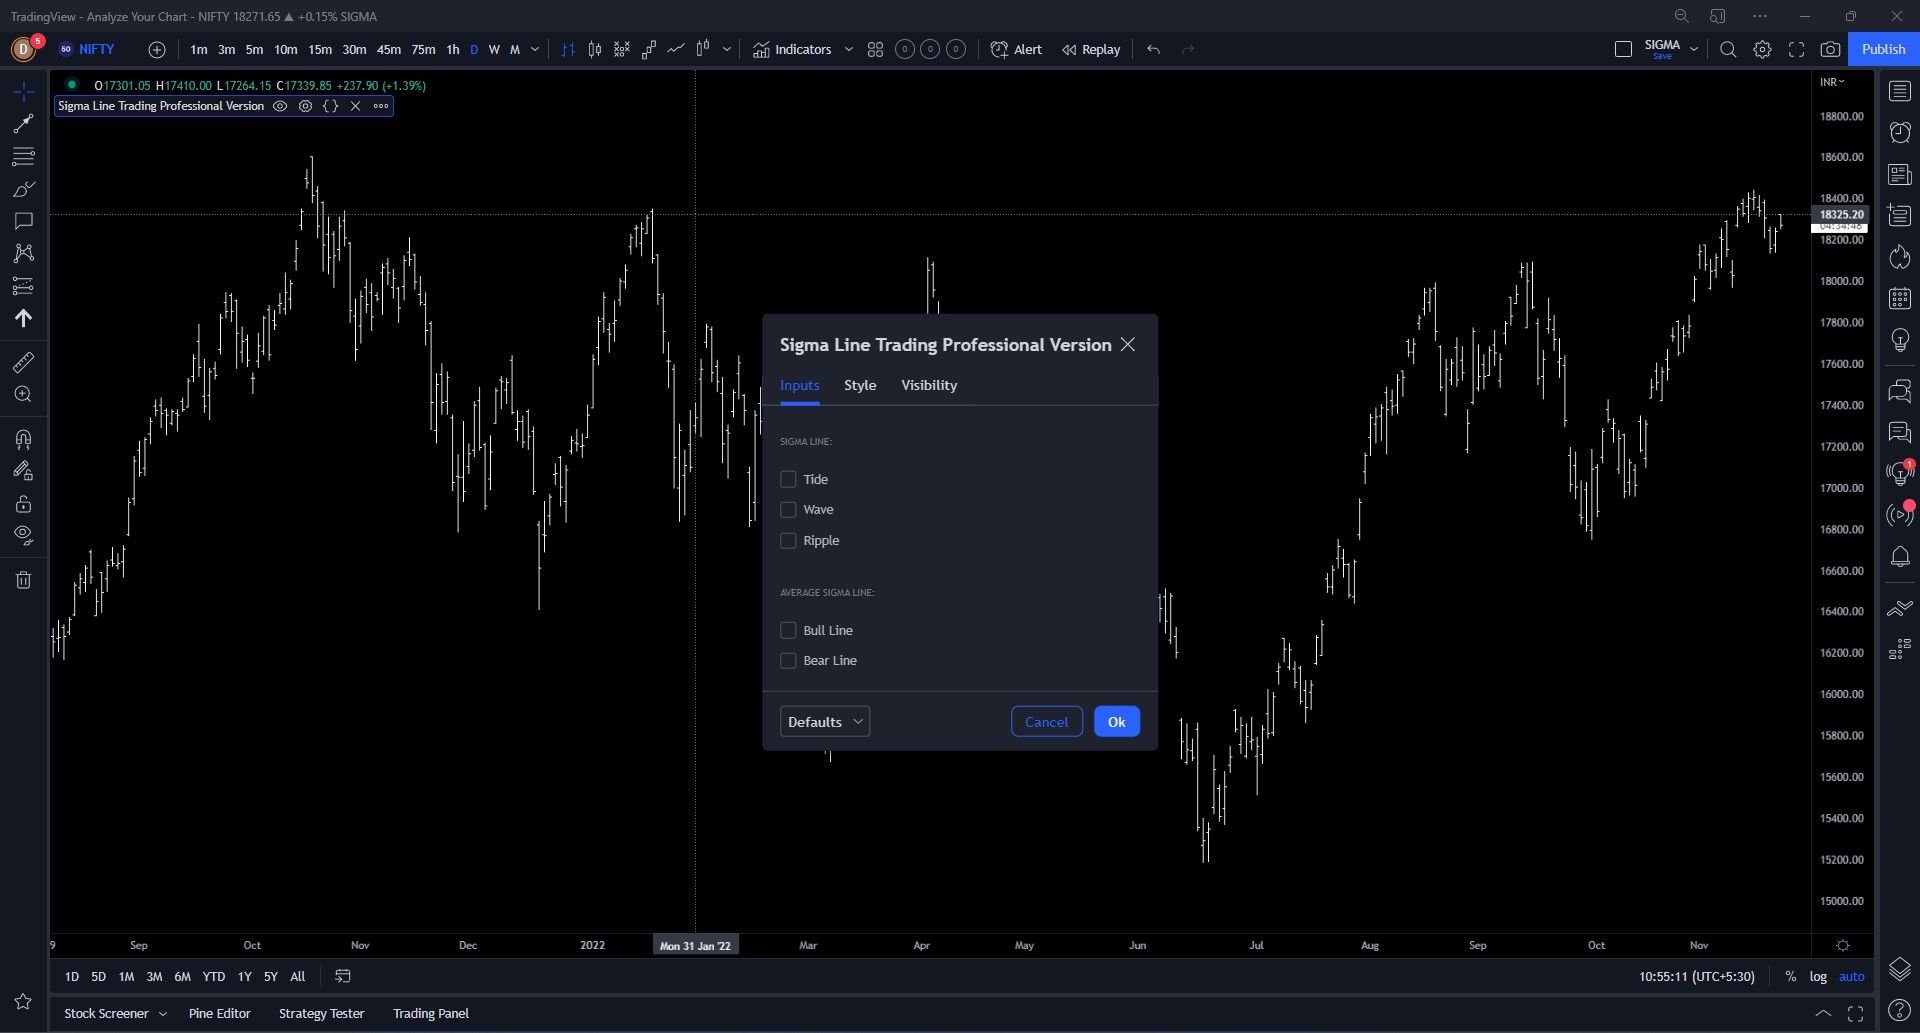
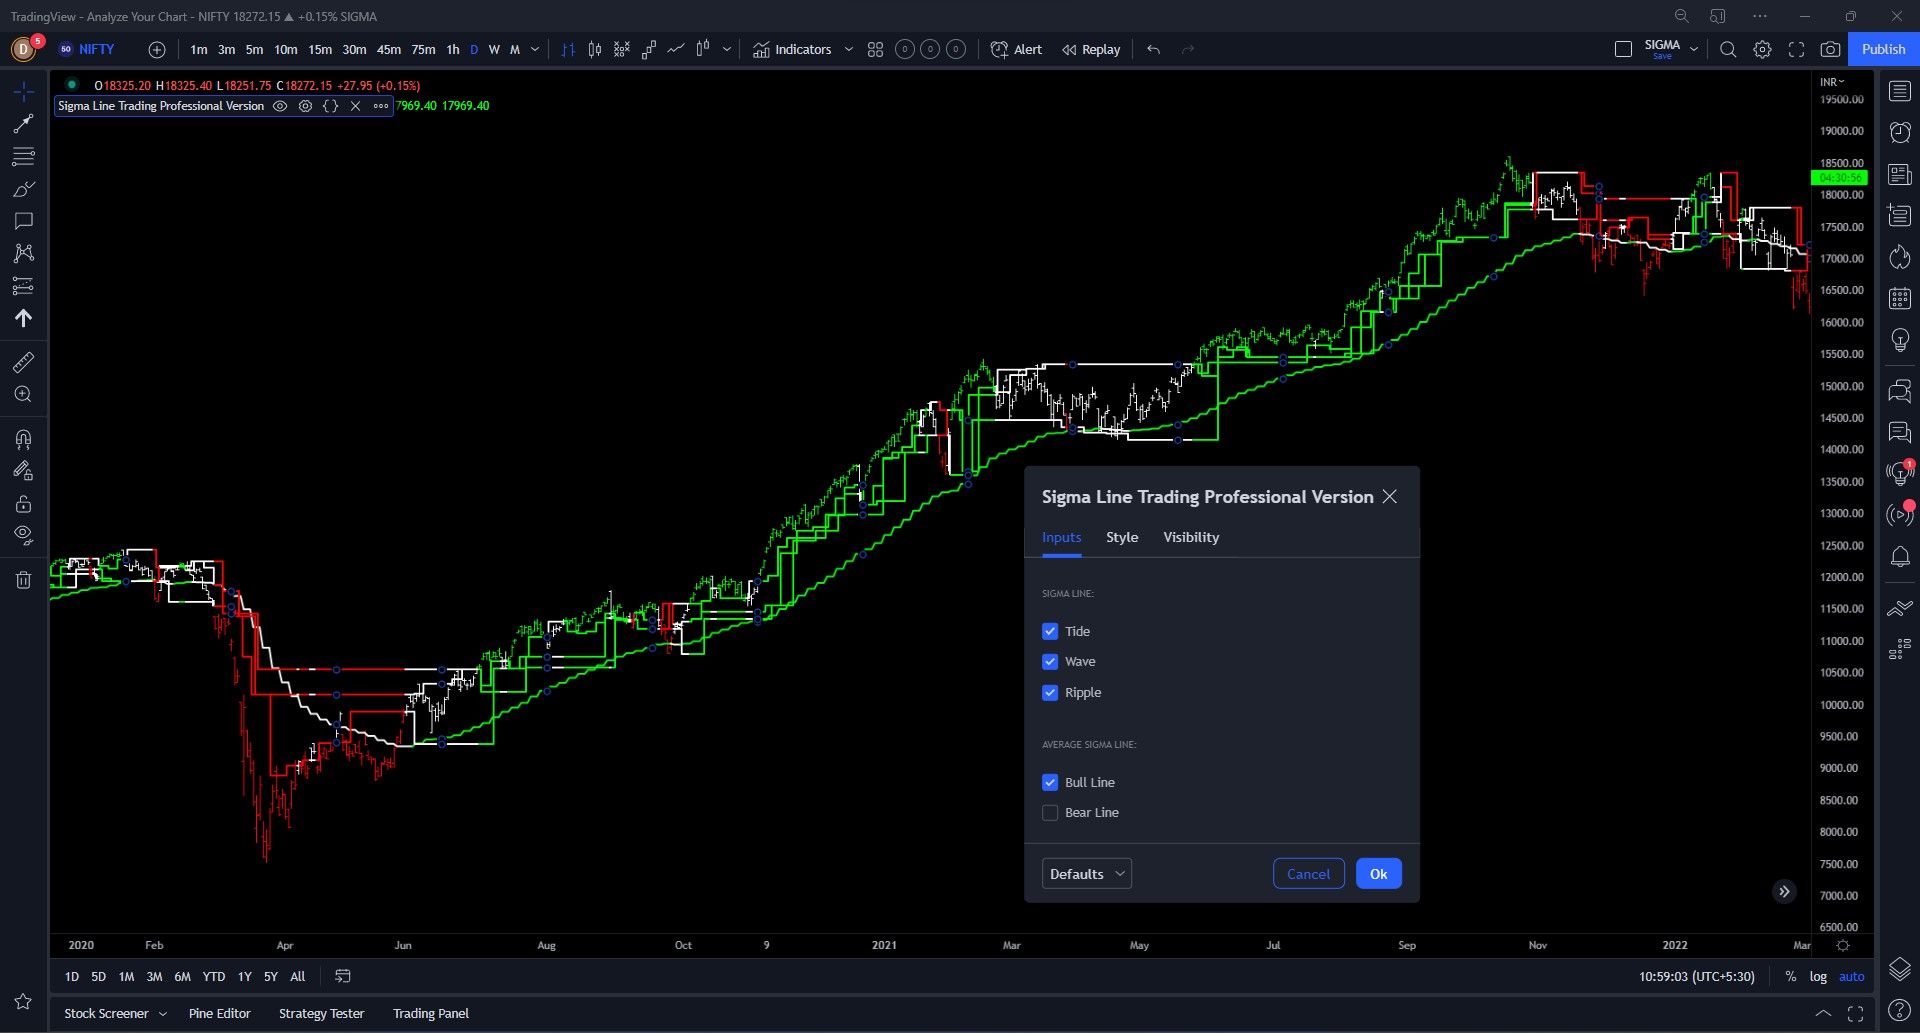
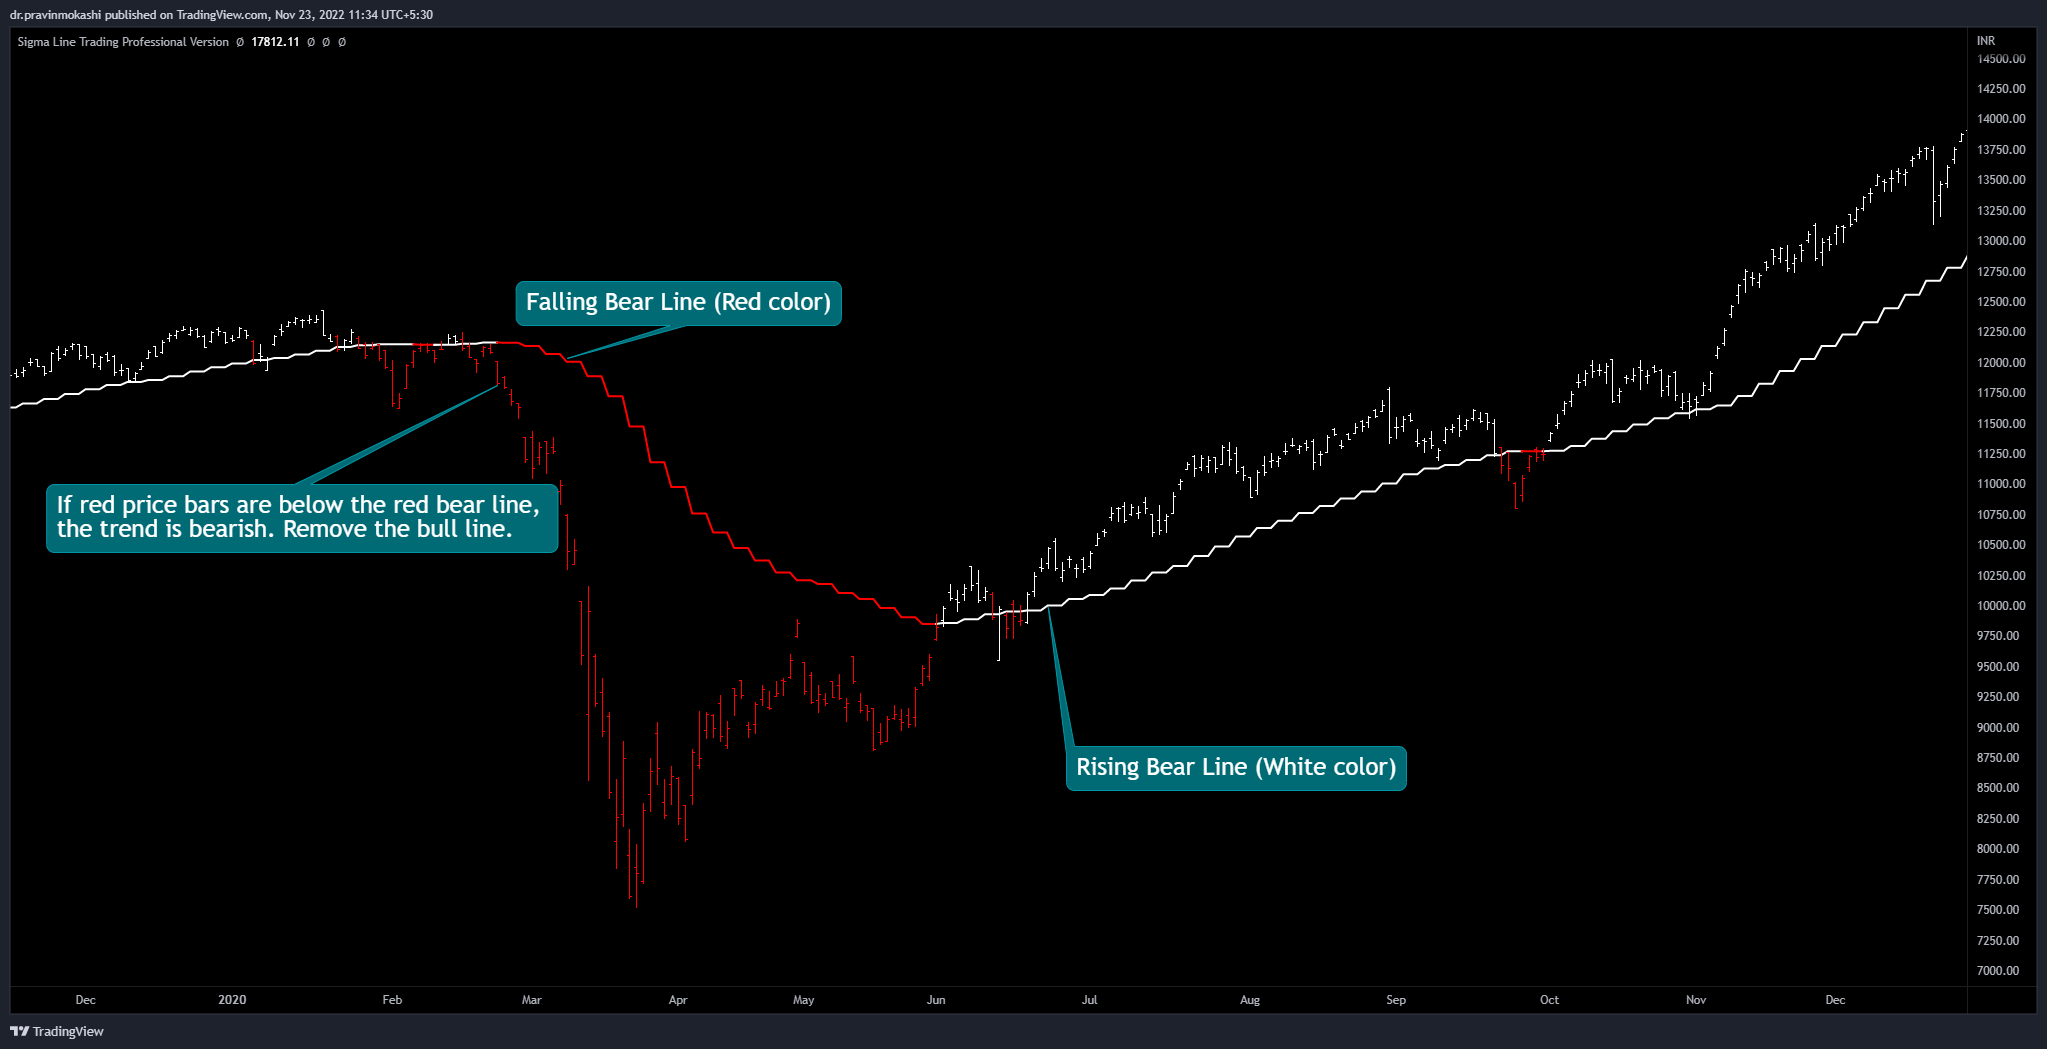
2. Select – Bull Line & Bear Line

...

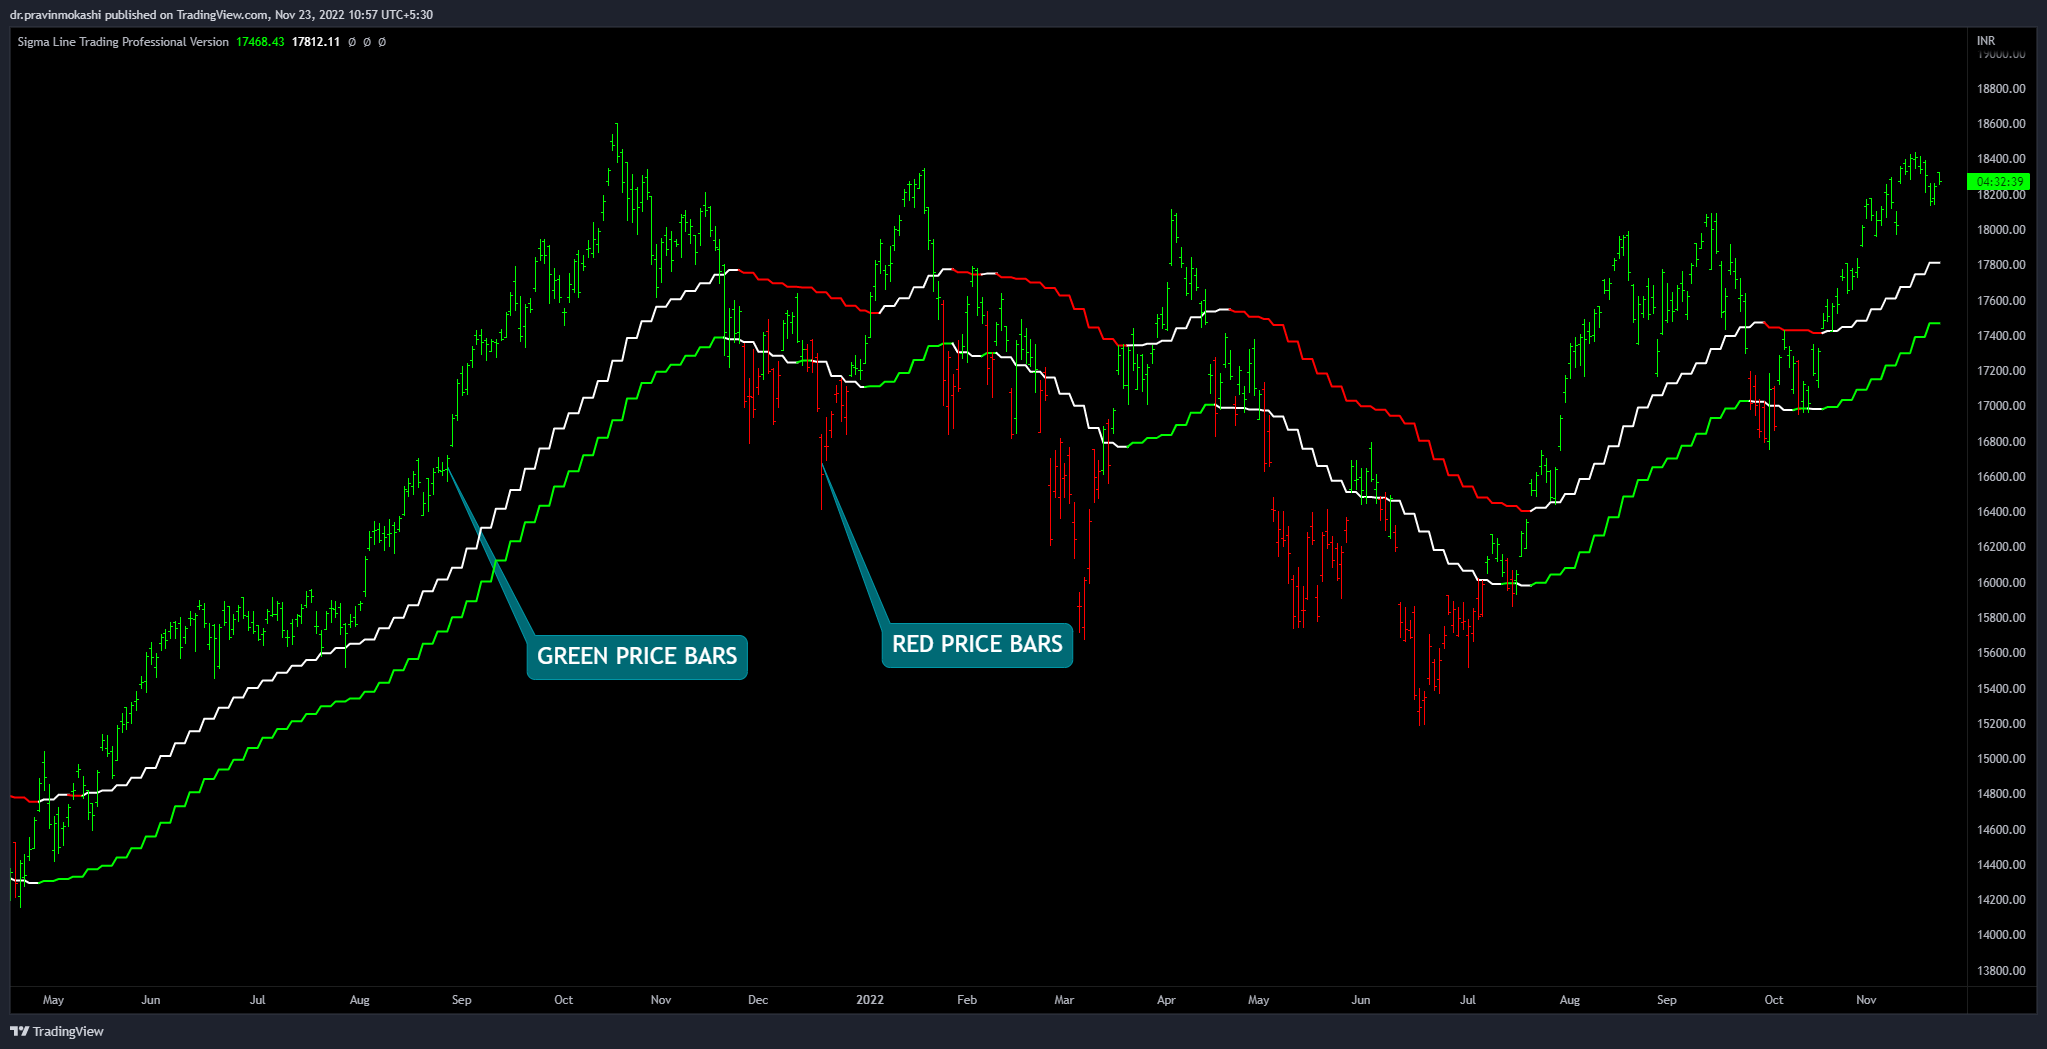
3. Watch the price bar colour

...

  • If green price bars are above the rising green bull line, the trend is bullish. Remove the bear line. ...

  • Click Tide, Wave & Ripple. ...

  • If green price bars are above the green Tide, Wave & Ripple, strong bullish trend is confirmed. Select one best sigma line to trade or invest. ...

    ...

  • If white price bars & sigma lines are seen in-between, it’s clutter. Either Tide, Wave or Ripple or any two sigma lines are clashing. ...

  • Remove the sigma line or lines causing clutter. Select one best sigma line. ...

  • If the entry is not clear, check chart on the lower time frame.
  • If the entry is clear, enter into a long trade, above & close to the selected sigma line & place a stop-loss below it. ...

  • Take care of earlier sigma line segments & higher price bars as resistances. ...

  • If the price bar close is below the Sigma Line, the trade is closed. ...

  • If the trade continues, keep trailing stop-loss below the selected sigma line. If necessary, another, more suitable sigma line can be selected at any time. ...

  • Book part profit to cover the stop loss risk. ...

  • Keep trailing stop-loss till it is hit & the trade is closed....

  • If red price bars are below the red bear line, the trend is bearish. Remove the bull line....

  • Click Tide, Wave & Ripple....

  • If red price bars are below the red Tide, Wave & Ripple, strong bearish trend is confirmed. Select one best sigma line to trade or invest....

  • If white price bars & sigma lines are seen in-between, it’s clutter. Either Tide, Wave or Ripple or any two sigma lines are clashing....

  • Remove the sigma line or lines causing clutter. Select only one best sigma line....

  • If the entry is not clear, check chart on the lower time frame.
  • If the entry is clear, enter into a short trade, below & close to the selected sigma line & place a stop-loss above it....

  • Take care of earlier sigma line segments & lower price bars as supports....

  • If the price bar close is above the Sigma Line, the trade will be closed....

  • If the bearish trend continues, keep trailing stop-loss above the selected sigma line. If necessary, another more suitable sigma line can be selected at any time....

  • Book part profit to cover the stop loss risk....

  • Keep trailing stop-loss till it is hit & the trade is closed....

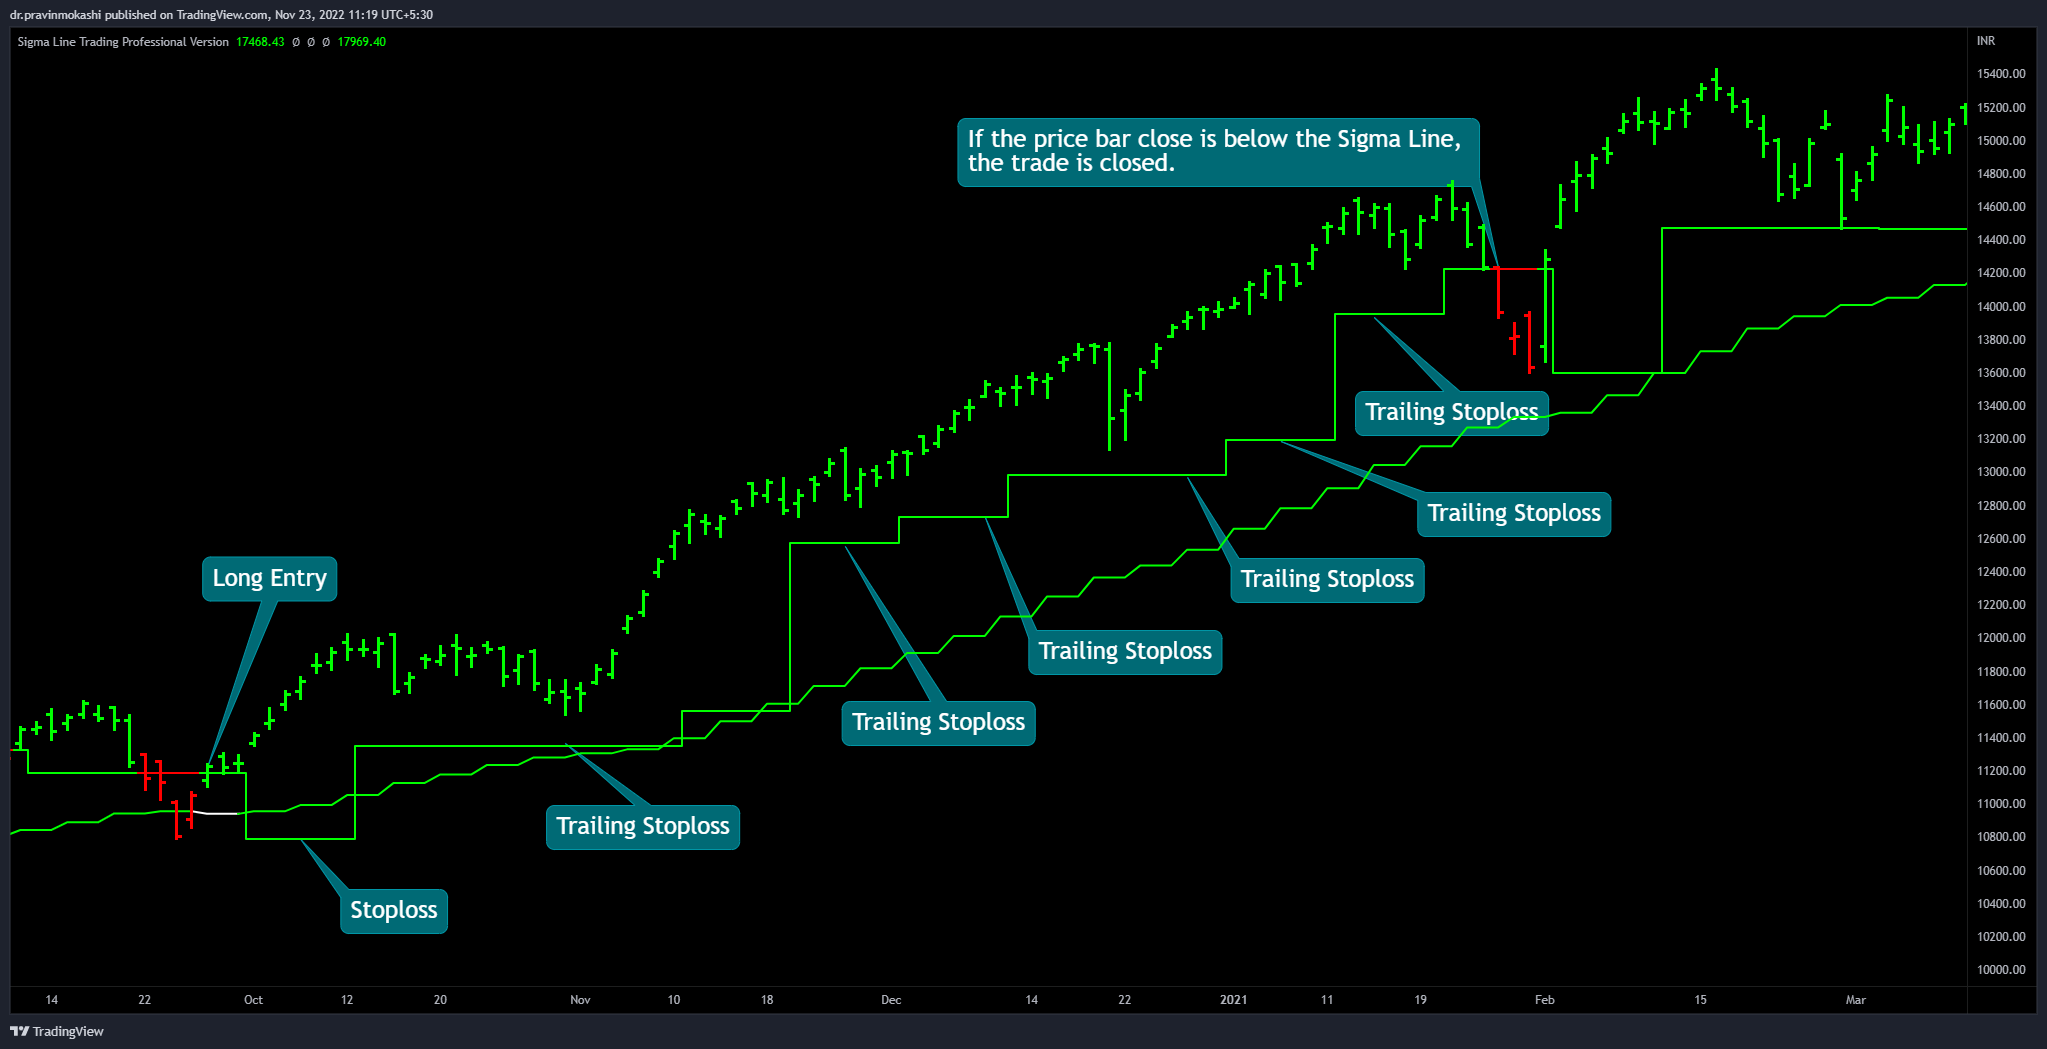
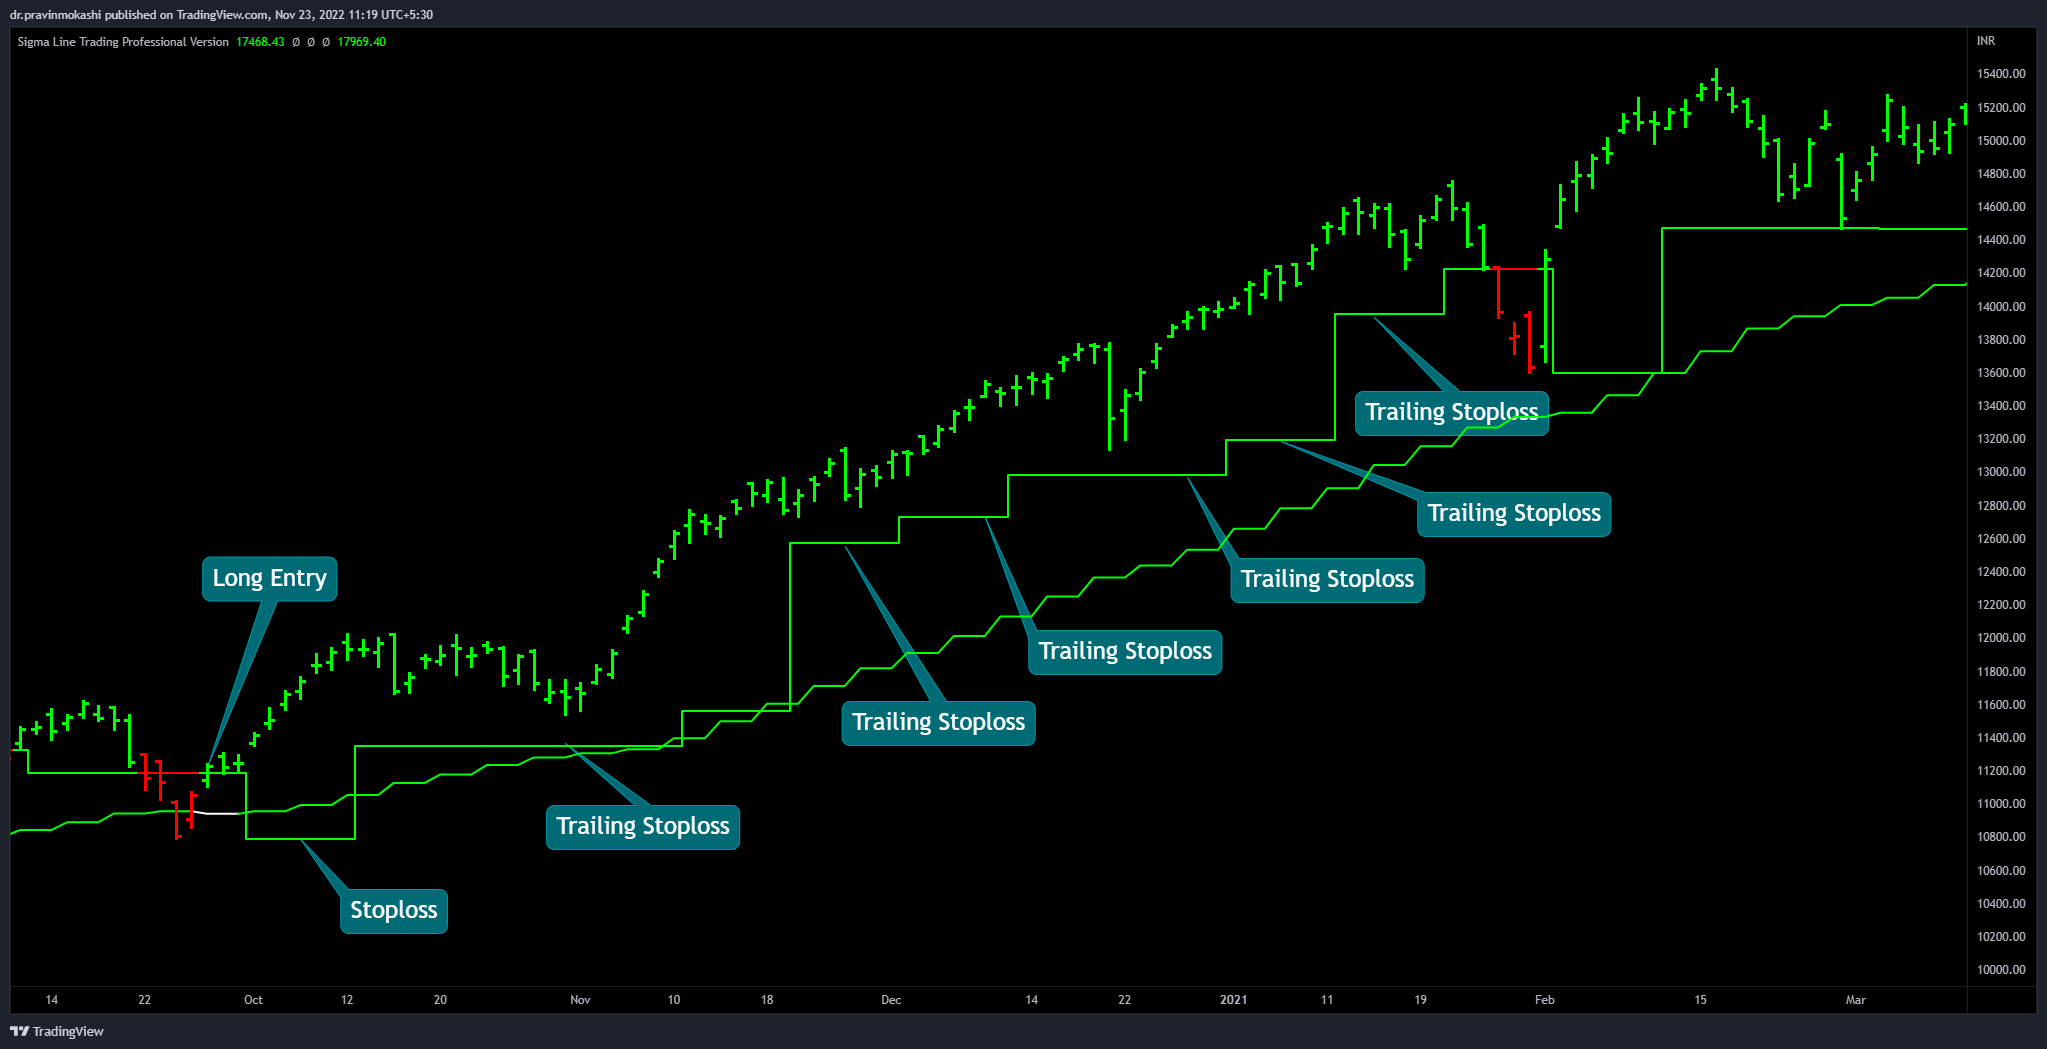
It has taken over 10 years of research to discover the simplest system of trading & investing ever. Test this method on the earlier charts for scalping, intra-day, swing, positional & investing. Start practically using sigma lines only after watching at least 100 cases.


Back to articles